您的购物车目前是空的!
16 Silver: Three Wise Kings 1994
Warren Buffett, Bill Gates, and George Soros show their interest in the silver market in the 1990s—investing in Apex Silver Mines, Pan American Silver, and physical silver. It is silver versus silver mining. Who would lead and who would lag?
“The financial markets generally are unpredictable.” —George Soros
At the beginning of May 2006, Bolivia’s leftist president Evo Morales practiced a little saber rattling as he threatened to nationalize the country’s domestic mining industry. A lot of silver was at stake, given Bolivia’s two important mines, San Cristóbal (part of Apex Silver Mines) and San Bartolomé (Coeur d’Alene Mines). (Morales had already implemented nationalization of the natural gas industry a week earlier.) In reaction, the stock prices of Apex Silver fell dramatically. From a price of 26 USD in April, the stock plunged to below 13 USD by June. It was a demonstration of how risky investments in mineral resources can be because of politics.
Some Facts About Silver
Silver is about 20 times more common than gold, with the most significant deposits found in North and South America. According to industry figures, there are only 25 relevant silver mines worldwide, and half of their sales are generated by precious metal production. The overwhelming share of global silver production is coupled to the extraction of other metals, especially lead, zinc, copper, or gold. According to the Silver Institute, industrial applications account for about 50 percent of total demand, followed by jewelry and photography.
For standardized silver trading on commodity exchanges, the ticker XAG stands for the price of a troy ounce of silver in USD. The center of physical silver trade is the London Bullion Market, and the London Bullion Market Association (LBMA) fixes an official price once a day. COMEX, part of the New York Mercantile Exchange, is the largest trading place for futures and options on silver. There silver futures are traded under the symbol SI, followed by the contract month and year (e.g., SIH0, Silver March 2020 Futures).
It’s not always clear, however, where the best investments lie. In the mid- and late 1990s, Warren Buffett, George Soros, and Bill Gates all entered the silver market as major professional investors, and their actions attracted attention within the international financial community. Like the three kings in the Bible, these men inspired private and institutional investors to follow their lead. However, though Soros, Buffett, and Gates all invested in silver, they used different instruments—physical silver and equity investments in silver-mining companies.

George Soros, born in Hungary in 1930, is known for the success of his Quantum Fund—a hedge fund founded by him and Jim Rogers—and for his bets in 1992 against the pound sterling, which forced the Bank of England to depreciate its currency. Today his net worth is estimated by Forbes to be around 14 billion USD. At the end of 1994, Soros invested in Apex Silver Mines and, together with his brother Paul, temporarily held more than 20 percent of the company. Founded in 1993, Apex owned 65 percent of San Cristóbal, a silver-zinc-lead mine in southwestern Bolivia that was estimated to contain 450 million ounces of silver. Apex also was active in Argentina, Bolivia, Mexico, and Peru.
Warren Buffett, also born in 1930, is the third-richest man in the world, with an estimated net private wealth of about 47 billion USD. As CEO of Berkshire Hathaway, an investment holding company he founded, he has demonstrated outstanding investment success over decades. The annual general meetings of the firm are reported to be a “Woodstock for investors,” with more than 20,000 people following every statement by the “Oracle of Omaha,” as Buffett is known.
In the mid- and late 1990s, Warren Buffett, George Soros, and Bill Gates all got involved in the silver market.
William “Bill” Henry Gates III, born in 1955, founded the Microsoft Corporation together with Paul Allen in 1975 and has a fortune of 53 billion USD, which made him the second-richest man in the world before he began to donate large amounts to charitable causes. In 1999 Gates got involved in Pan American Silver as the third big investor in the silver market after Soros and Buffett.
Buffett tried a different strategy. In 1998, before official publication of its annual financial statements, Berkshire Hathaway announced that the company had acquired a total of 130 million troy ounces of silver between July 25, 1997, and January 12, 1998. That was about 4,000 metric tons of silver, which accounted for about 20 percent of the global annual mine production. For Berkshire Hathaway, however, this represented a mere 2 percent of its total invested capital.
The investment in the physical metal surprised the international financial community, as Buffett had always been known for his value-oriented equity investment style. In this case his rationale was based on the discrepancy between supply and demand in the metal over the previous few years and a significant decline in inventories. The increase in silver price that followed proved him right. His investment was very profitable.
As for Bill Gates, it became public in September 1999 that through Cascade Investment LLC he had purchased more than three million shares of Pan American Silver at an average price of about 5.25 USD. This represented 10 percent of the company, which was founded in 1994 and which now had a portfolio of silver-mining projects in Mexico, Peru, Bolivia, and Argentina.
Looking at the price performance of silver versus share price performance of Apex Silver and Pan American Silver since 1997, an interesting picture emerges.
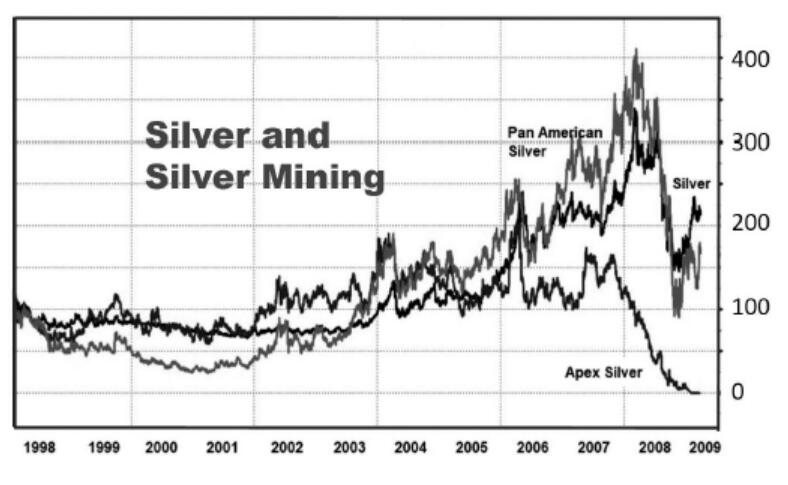
By the end of 2008, silver was performing the best, followed by the share price of Pan American Silver. Although Apex Silver shares first traded in line with silver and with Pan American Silver, it later crashed: It fell 90 percent between its IPO in 1997 and the end of 2008. Bankruptcy followed. What had happened?
When Bolivian president Morales threatened mining companies with nationalization, investors panicked.
President Morales’s threat to nationalize Bolivian mining projects unsettled investors. Actually, in place of a direct nationalization, the tax burden in Bolivia was heavily increased. Nevertheless, Apex Silver was forced to a sell part of its flagship asset to Sumitomo. Developing the San Cristóbal Mine became more and more expensive, as the cost of energy exploded. In order to obtain credit, Apex Silver had to sell futures in high quantities of silver, zinc, and lead. As commodity prices rose, these hedges led to increasing losses, and in January 2009 the company announced bankruptcy.
So which investment was better? The share price of both Apex Silver and Pan American Silver temporarily outperformed silver, because annual production and the value of total mineral resources in the ground had a leverage effect. But leverage is the price investors pay for entrepreneurial and market risk. And when compared to Apex Silver, an investment in physical silver proved to be the much safer bet.
Key Takeaways
•Warren Buffett, Bill Gates, and George Soros became interested in the opportunities offered by the silver market in the 1990s.
•Over a decade, the price of silver climbed from below 4 USD to more than 8 USD in 1997. It reached 22 USD in 2008.
•Silver mining companies seemed to offer a much higher return than a direct investment in silver, but this higher expected return came with a price.
•Because of the rising silver price, Bolivian president Evo Morales threatened to nationalize his country’s domestic mining industry. Shares of Apex Silver crashed by more than 90 percent from its IPO in 1997, followed by bankruptcy.
17 Copper: “Mr. Five Percent” Moves the Market 1996
The star trader of Sumitomo, Yasuo Hamanaka, lives two lives in Tokyo, manipulating the copper market and creating record earnings for his superiors but also carrying on risky private trades. In the end, Sumitomo endures a record loss of 2.6 billion USD, and Hamanaka is sentenced to eight years in prison.
“Who is Mr. Copper?” Investopedia
For years Yasuo Hamanaka was the head trader at Sumitomo Trading in Tokyo, the commodity trading subsidiary of Japanese conglomerate Sumitomo. In insider circles he was known by his nicknames—“Copper Fingers” or “Mr. Five Percent,” because he controlled as much as 5 percent of the global copper market. He earned huge profits for his company. However, on June 5, 1996, Hamanaka revealed that he’d lost 1.6 billion USD of his company’s money. Since then, the Sumitomo scandal has been considered one of the biggest financial frauds in recent history.
Some Copper Basics
The global production of copper, which is used mainly in construction and electrical and mechanical engineering, is around 20 million metric tons. Chile is the largest producer, with about one-third of the world’s output, followed by Indonesia, the United States, and Australia. Copper can be recycled and reprocessed almost without loss of quality, and along with aluminum, it is the most frequently traded industrial metal. The two most important exchanges are the London Metal Exchange (LME) and the New York Mercantile Exchange (NYMEX). At LME copper trades in US dollars per ton; at NYMEX, in US cents per pound. In the United States, the ticker symbol is HG, followed by the contract month and year (e.g., HGZ9, for copper with delivery in December 2019). Currently copper costs 2.80 USD per pound, or 5,600 USD per ton.
In 1985 Yasuo Hamanaka, a 37-year-old expert in copper trading on the commodity futures markets, was hired by the Sumitomo Corporation in Tokyo. His department suffered a considerable loss in the mid-1980s, but the head of trading, and later Hamanaka himself, managed to conceal it with secret trades. Contrary to company tradition in which a trader changed position after a certain period of time, Hamanaka remained at his post for 11 years, because he generated such high profits.
The Japanese trader Yasuo Hamanaka was a dominant factor in global copper. But he lost his bet against China.
Any allegations about market manipulation and fraud from the LME went unheeded, while Hamanaka’s influential comments about rising copper demand and the occurrence of an artificial shortage were often published in the financial press. Even as Sumitomo’s star trader was making a modest impression, however, he was actually living a double life, professionally and privately. During the day he officially traded for Sumitomo; secretly at night he traded for himself on the LME and NYMEX. He lived with his family of four in a small house in Kawasaki, an unattractive Tokyo suburb, and drove a small car. But he enjoyed expensive trips with a lover from the Ginza entertainment district and—of course—had a Swiss bank account.
Beginning in 1993, Hamanaka recognized that the Chinese economy was developing an enormous demand for copper due to its fast industrialization, and he bet that prices would rise. However, the Chinese put the market under pressure by talking down the price. Hamanaka’s losses started to pile up. He faked balance sheets, trading reports, and his superiors’ signatures in order to obtain additional credit lines to increase his positions and move the market in the “right” direction. But the Chinese seemed in no hurry to buy. By the end of 1995 and the beginning of 1996, the situation was slowly becoming critical. Now mentally unstable, Hamanaka was drinking heavily.
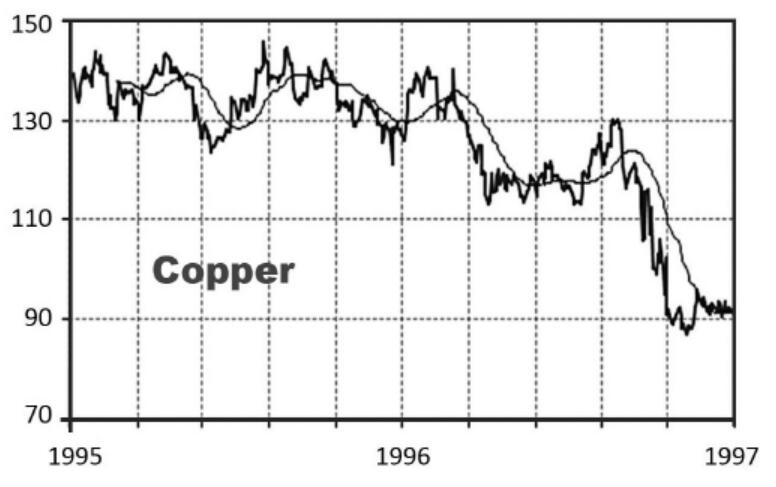
In June 1996, the star trader had no choice but to admit the extent of his losses: Uncovered futures positions came to 1.8 billion USD. Shocked, Sumitomo dismissed Hamanaka, and in a panic it liquidated all positions. This caused another 800 million USD in losses for the company, as the price of copper dropped by 27 percent in a single day due to the sheer volume of the sales orders. In the end, the Sumitomo Corporation realized a loss of 2.6 billion USD, the biggest ever for a single company in the international financial markets.
By liquidating copper futures positions it could not cover, the Sumitomo Corporation faced a loss of 2.6 billion USD.
Afterward, reporters wondered how a single trader could have concealed such an unprecedented loss from his superiors. Obviously, internal audits, risk management, and supervision at Sumitomo had failed because, despite the immense transaction volume, none of Hamanaka’s superiors knew about his deals in detail. As for Hamanaka himself, the public considered him a criminal offender. He admitted his guilt in court and was sentenced to eight years’ imprisonment in 1998.
Key Takeaways
•Yasuo Hamanaka began trading copper for the Japanese conglomerate Sumitomo in 1985. Because of the size of his orders, and his control of up to 5 percent of the global copper market, Hamanaka earned the nicknames “Copper Fingers” and “Mr. Five Percent.”
•After 1993, Hamanaka bet on rising copper prices caused by increasing Chinese demand, but when prices continued to fall, he lost money. Hoping that prices would recover, Hamanaka continued to hide his cumulative losses through secret trades.
•In 1996, however, Hamanaka was forced to reveal a loss of 1.8 billion USD. Shocked, his superiors ordered all positions to be sold immediately, which caused a 27 percent drop in copper prices in a single day and resulted in an additional loss for Sumitomo of 800 million USD.
•The Sumitomo copper scandal in Japan of 1996 was one of the biggest financial frauds in history; a single person caused a loss of 2.6 billion USD.
18 Gold: Welcome to the Jungle 1997
In the jungle of Borneo, the Canadian firm Bre-X supposedly finds a gold deposit with a total estimated value of more than 200 billion USD. Large mining companies and Indonesian president Suharto all want a piece of the pie, but in March 1997 the discovery turns out to be the largest gold fraud of all time.
“Geologically, it’s the most brilliant thing I’ve ever seen in my life! It’s so big, it’s scary. It’s f***ing scary!” —John Felderhof, Bre-X
“This can’t be a scam! Do some more tests! Figure it out! I know it’s there, okay?” —Peter Munk, Barrick Gold
St. Paul is a remote community with roughly 5,000 inhabitants northeast of Alberta, Canada. Its only tourist attraction has been a landing platform for UFOs that was erected on June 3, 1967. In the middle of the 1990s, however, the tiny town became the focus of international media: Every 50th resident was a shareholder of the mining company Bre-X, whose value had increased 500-fold within just three years. As a result, the number of millionaires in St. Paul had suddenly shot up dramatically. At the center of attention was John Kutyn, an employee of the local savings bank, who had sold everything, including his car and his motorcycle, to invest in Bre-X early on.
St. Paul, a small Canadian community of 5,000, recorded a sudden surge in resident millionaires.
Kutyn spread the news about the gold discovery of the century among his neighbors and customers. He would be one of the few who managed to exit the company before it collapsed. A wealthy man, he went on to settle in New Zealand.
Where’s the Gold?
Based on industry estimates of the World Gold Council, around 190,000 metric tons of gold have been produced throughout history, of which one-fifth is stored in central bank vaults. The main gold-producing countries are China, Australia, Russia, the United States, and Canada, followed by Peru, Indonesia, South Africa, Mexico, and Ghana. Together, these 10 countries account for around 75 percent of global mine production. Former number-one gold producer South Africa now barely makes the top 10. Though it dominated gold mining for more than 30 years, the country’s production peaked in the 1970s.
The center of global gold trading is the London Bullion Market, and most of the demand comes from the jewelry industry, followed by investors and industrial applications. The largest gold-producing companies in terms of volume are Barrick Gold, Newmont Mining, and Goldcorp.
In the 1980s Canada had witnessed a boom in exploration companies, which searched the world for crude oil, gold, and other commodities. Among them was Bre-X, founded by former stockbroker David Walsh late in the decade. From an initial 0.30 Canadian dollar (CAD), the value of Bre-X shares fell to a few cents in 1993. But that would change after Walsh and a geologist named Felderhof bought exploration rights for Busang in the jungle of Borneo, Indonesia. Together with his colleague Mike de Guzman, Felderhof had explored Busang for another company in the mid-1980s, and the two men had found small traces of gold. On May 6, 1993, Bre-X announced that it had acquired a license for Busang. At that point the share price was around 0.50 CAD. But drilling samples validated gold levels of more than 6 grams per ton of rock. Since 3 grams are considered an excellent result, this caused a sensation.
Was Busang home to the biggest gold treasure of all time?
It wasn’t long before analysts picked up the Bre-X story. In March 1994 the stock rose to 2.40 CAD. By September, after a year of exploration and testing, the management of Bre-X estimated that Busang’s ore resources were between 3 and 6 million ounces of gold. As Bre-X’s drill results got better and better, gold experts and analysts published ever more optimistic forecasts.
In November 1995 Busang’s gold resources were estimated at more than 30 million ounces, and toward the end of the year the stock price of Bre-X shares climbed above 50 CAD! At the annual general shareholders’ meeting in May 1996, the company was valued at 200 CAD per share, which then split by 1:10. The estimates kept rising: Bre-X reported more than 39 million ounces of gold in June 1996, 47 million ounces in July, 57 million ounces in December, and 71 million ounces in February 1997. Shortly afterward, Felderhof publicly speculated about resources of more than 100 million ounces. This would have made Busang the richest gold deposit of all time. Market rumors even doubled the estimate: Some 200 million ounces, about 6,000 tons, were supposed to lie hidden in the jungle of Borneo!
Though the company had not produced a single ounce of gold, Bre-X shares rose 500-fold.
At the beginning of September 1996, the stock reached its highest price—28 CAD (which corresponded to a price of 280 CAD before the stock split) and a market capitalization of more than 4 billion USD. In just three years the value of Bre-X shares had increased by more than 500 times, even though not a single ounce of gold had been commercially produced!
In the meantime, the industry’s big names—Placer Dome, Newmont Mining, Barrick Gold, and Freeport-McMoRan—were also taking part in the race for Busang. Indonesian president Haji Muhammed Suharto wanted his share of the treasure, too. In December 1996 the Indonesian government, Bre-X, and Barrick Gold agreed to divide Busang among themselves. The following February, Freeport joined the group.
But then things began to fall apart. On March 19, 1997, Mike de Guzman committed suicide by jumping from a helicopter. During the due-diligence process, independent drill holes had revealed only negligible amounts of gold. A week later, lab results showed that Bre-X had manipulated the initial samples. It was a personal disgrace for Peter Munk, the head of Barrick Gold, and the news caused investors to panic. The share price of Bre-X collapsed, and the stock was suspended from trading. Later Bre-X had to declare bankruptcy, and the stock became worthless.

The Bre-X fraud remains one of the biggest capital market scandals in Canada and the biggest mining scandal ever recorded, causing serious lingering damage to the reputation of the Canadian stock market. Major investors who were hurt included the Ontario Municipal Employees Retirement Board, the Quebec Public Sector Pension Fund, and the Ontario Teachers Pension Plan. In addition, many small investors, including some 200 residents of St. Paul, saw their money vanish into thin air.
Bre-X crashed. The stock was worthless.
Not everyone suffered. David Walsh capitalized 35 million USD by selling Bre-X shares before the collapse and moved to the Bahamas. John Felderhof was able to sell nearly 3 million Bre-X shares, with a total value of almost 85 million CAD, between April and September 1996. He found a new home in the Cayman Islands. The Bre-X scandal was finally settled in 2002. However, legal disputes continue today.
Key Takeaways
•The Bre-X scandal remains the biggest corporate mining scandal in Canada to date.
•In 1993 David Walsh and John Felderhof claimed to find the gold deposit of the century in Borneo. Their company, Bre-X, rose from a penny stock, trading below 30 Canadian cents, to 4 billion USD in market capitalization. From mid-1993 to mid-1996, the value of Bre-X shares increased by a multiple of 500. Indonesian president Haji Muhammed Suharto and large multinational gold companies all wanted a piece of the pie.
•But in March 1997 the discovery was unmasked as the largest gold fraud of all time. Lab results confirmed that the company had manipulated its gold samples. Bre-X declared bankruptcy; its stock was worthless.
19 Palladium: More Expensive Than Gold 2001
In 2001 palladium becomes the first of the four traded precious metals—gold, silver, platinum, and palladium—whose price breaks the psychological mark of 1,000 USD per ounce. That represents a tenfold increase in just four years. The reason lies in continuing delivery delays by the most important producer: Russia.
“The actual level of Russian stockpiles of palladium is a closely guarded state secret.” —United Nations Conference on Trade and Development
Russia is the epicenter of the global palladium market, due to its high share of world annual production and its strategic inventories, which were built up through overproduction in the 1970s and 1980s. Since palladium is mainly a by-product of the production of other metals such as platinum or nickel, the production of palladium continues even when the supply of the metal is sufficient and prices are low.
Russia dominated global palladium production and held significant inventories.
The majority of palladium comes from Russia—and from a single spot, the Norilsk nickel deposit in northern Siberia. If supplies of Norilsk nickel are unable to keep pace with demand, stocks held by the Russian precious metals authority Gokhran, which is under the supervision of the Ministry of Finance, and the Russian Central Bank, fill the gap.
A Palladium Primer
Together with platinum, ruthenium, rhodium, osmium, and iridium, palladium is part of the platinum group of metals (PGM). More than 50 percent of the market for the metal depends on automobile catalysts and other industrial processes, though palladium is also used in jewelry. On average over the past five years, just over 50 percent of the annually mined palladium has come from Russia. Other important producer countries are South Africa, which accounts for just under one-third of global production, and the United States, with 15 percent of the global supply. With an annual production volume of around 220 metric tons, the market for palladium is significantly smaller than, for example, gold or silver. (For comparison, around 3,000 metric tons of gold and 24,000 of silver are produced each year.)
The London Bullion Market Association’s (LBMA) twice-daily price fixing is the most internationally recognized price reference, and futures in palladium are traded in the United States (NYMEX) and Japan (TOCOM).
In the late 1990s the development of automobile catalysts made palladium an important industrial metal, and it was increasingly used instead of platinum because of the relatively low price at the time. But lack of deliveries from Russia started to drive the price up.
In 1997 palladium deliveries from Russia halted for seven months. The next year deliveries stopped again. Moreover, analysts began to question the actual physical availability of the metal. It seemed that a large share of the palladium inventory had been collateralized by Western banks for credits in the aftermath of the Russian Financial Crisis of 1997.
The price of palladium rose from 120 USD to more than 1,000 USD, making the metal more valuable than gold, silver, and platinum.
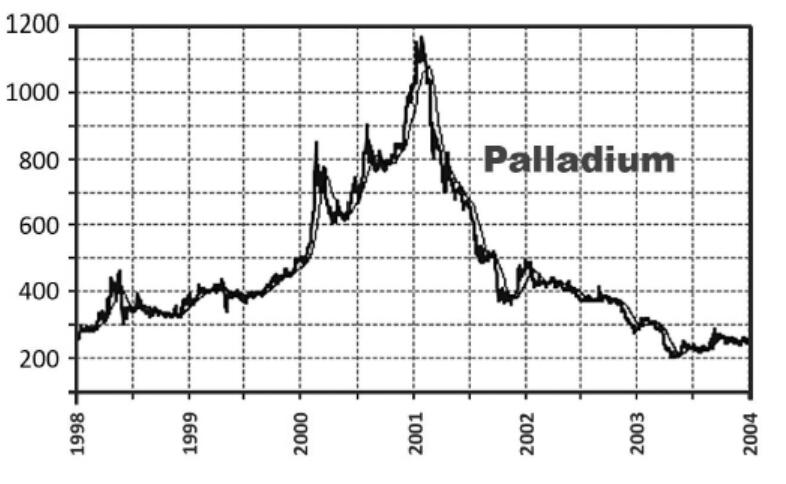
The price of palladium rose from 120 USD per ounce in early 1997 to more than 200 USD in 1998. In April of that year, the price of the metal surpassed the gold price for the first time since 1971, due to continued supply disruptions in Russia. And the prices for palladium continued to climb: to 400 USD, then to 600 USD. In February 2000 the price of palladium skyrocketed to more than 800 USD, while the price of gold averaged just under 300 USD during that period. It seemed as though the price would consolidate, but instead it rose again to 1,000 USD.
At the beginning of 2001, palladium broke through the psychological barrier of 1,000 USD, the first of the four traded precious metals—the others are gold, silver, and platinum—to do so. The shortage pushed the price up to almost 1,100 USD at the end of January 2001. The value of palladium had increased almost tenfold in just four years!
It didn’t last. Subsequently, the value of palladium fell as low as 200 USD, after Russia announced long-term supply contracts with Japan, which were expected to start in January 2001. Then, during the commodity boom in the first decade of the new millennium, the price of palladium once again reached 600 USD before consolidating. Still this represented only a triple rise, compared with a multiple of 10 in 2001.
In 2015 a major emissions scandal in the car industry (“Dieselgate”) fueled another palladium rally. In September of that year, the US Environment Protection Agency (EPA) issued a notice of violation of the Clean Air Act to the Volkswagen Group. The German car manufacturer had intentionally manipulated data and software in its diesel engines to meet emissions limits. The scandal spread to other manufacturers and raised awareness of the higher levels of pollution emitted by diesel-powered vehicles. The price of palladium, which was used in catalysts for gasoline cars, more than doubled, from less than 500 USD in mid-2015 to more than 1,100 USD at the end of 2018. At the beginning of 2019, Palladium was trading at 1,320 USD, once again higher than gold. Investors are wondering how long the rally will last this time . . .
Key Takeaways
•More than 90 percent of palladium reserves are found in Russia and South Africa. The metal (together with platinum) is predominantly used in automobile catalyst systems and related industrial applications.
•In January 2001 palladium prices rose to 1,100 USD, 10 times the value of four years before.
•Palladium became more valuable than gold, silver, or platinum, as Russia, the biggest producer and exporter of the metal, withheld shipments.
•Dieselgate, the global diesel-related emissions scandal, fueled a new rally in palladium, whose prices have more than doubled again since 2015.
20 Copper: Liu Qibing Disappears Without a Trace 2005
A trader for the Chinese State Reserve Bureau shorts 200,000 tons of copper and hopes for falling prices. However, when copper prices climb to new records, he disappears and his employer pretends never to have heard of him. What sounds like the plot of a thriller shocks metal traders all over the world.
“It’s one thing to have a rogue trader on your staff—that happens. But I’d be amazed if China wanted a reputation as a rogue nation in these markets, where it has become such an important player.” —Anonymous trader
Most people even have trouble pronouncing the name Liu Qibing, but in November 2005 the Chinese copper trader was the number-one topic of conversation on the commodity futures exchanges in London, New York, and Shanghai. Rumors were circulating about a massive, speculative short position in the copper market: Liu Qibing, in his capacity as a trader for the Chinese State Reserve Bureau (SRB), was said to have shorted futures contracts on the London Metal Exchange (LME) amounting to 100,000 to 200,000 tons.
Unlike Yasuo Hamanaka in Japan almost ten years earlier, Liu Qibing was speculating on falling copper prices. However, prices continued to rise, and the talk of a massive short position temporarily drove London’s three-month-forward copper contracts to a record high of nearly 4,200 USD per metric ton.
Starting at 1,500 USD, the copper price bounced up to 9,000 USD per ton.
Copper prices had started to climb since the turn of the millennium. In December 2003 the price of copper broke the 2,000 USD per ton mark for the first time, while the average price of previous years was only slightly above 1,500 USD. Just a few months later, the price breached the 4,000 USD level. The trigger for this development lay in the growing demand of the Chinese economy, which required more and more of the red metal for its infrastructure and housing industry. Although the OECD countries (members of the Organisation for Economic Co-operation and Development) collectively consumed about 80 percent of the world’s copper output at that time, China’s growth was more dynamic. Copper consumption in OECD countries increased on average by 2.5 percent per year over the previous five years. However, China’s demand grew by about 15 percent per year over the same period, while supply growth proved inflexible. At peak times China’s demand growth accounted for more than 80 percent of global demand growth.
China was sucking global copper markets dry.
At that time China alone accounted for a quarter of the world’s copper consumption. Meanwhile, the prices for industrial metals continued to rise, because producers were slow to respond with an increased supply. There were several reasons for their reluctance: First, the development of new mines usually takes several years until the first ton of copper can be produced. Second, many producers didn’t trust the high price level to last and therefore delayed long-term investment projects. By 2004, however, the extension of existing projects and the activation of new mines were entering a decisive phase. Experts—including the world’s largest copper producer, Chilean Codelco, and the Chinese State Reserve Bureau—expected the supply to increase at the end of 2005, and the rise in copper prices should have come to an end. As it turned out, that was a misperception for which China paid dearly.
Contrary to expectations, almost all major producers had problems with production. Costs increased; high oil prices, strikes, and even earthquakes all had a lasting effect. The projected additional supply in the copper market was lagging, and demand, continually fueled by China’s dynamic economic growth, was jumping ahead. As a consequence, the price rose steadily. The rumors surrounding Liu’s positions created additional momentum, as copper inventories on commodity futures exchanges in London, New York, and Shanghai reached their lowest levels in 30 years.

The newspaper China Daily reported that 130,000 metric tons of copper were sold by Liu Qibing for the SRB at an average price of 3,300 USD per ton. As the price of copper rose above 4,000 USD, Liu broke off contacts with other traders in London and China and disappeared. His cell phone remained silent, the door of his apartment on the 10th floor of a Beijing building never opened, and he was absent from his job in Shanghai.
The Chinese trader broke off all contacts, never answered his cell phone, and his employer denied his existence.
At first Liu’s employer denied he existed. Later, the SRB claimed that the trader was acting solely on his own behalf. The SRB, which was founded in 1953, was supposed to stabilize prices and secure supplies through commodity trading, not earn profits through speculation. Industry experts considered the 36-year-old trader, who was under house arrest according to Chinese sources, more a pawn than a perpetrator.
Liu, the son of a farming family from Hubei Province, had been with the SRB since 1990 and had been trained for futures and options trading at the London Metal Exchange (LME). Between 2002 and 2004, Liu is said to have generated more than 300 million USD in risky copper trades for the SRB. Now, the Chinese state was facing losses of hundreds of millions of dollars. In response, the government in Beijing tried to push down the world market price through copper auctions. In a first tranche, 50,000 tons were sold. Another tranche of a similar size was to follow, and the leadership in Beijing spread the word that the country had 1.3 million tons of copper in reserve. However, market participants estimated that the amount of copper available was just half that. The Chinese government’s actions were unsuccessful, as more and more market participants took counter-positions to force China to make physical delivery of the metal in late December.
Hedge funds—called “crocodiles” in China—particularly saw an opportunity to generate short-term profits. The copper price climbed above 5,000 USD in January 2006, to 6,000 USD in early April, and to 7,000 USD at the end of that month. It rose to the dizzying heights of nearly 8,800 USD a ton in May, before normalizing again over the coming months.
Key Takeaways
•Like the Japanese trader Yasuo Hamanaka almost 10 years before, Chinese trader Liu Qibing was caught on the wrong side of the copper market. He speculated on falling prices and lost a great deal.
•Liu was working for the Chinese State Reserve Bureau (SRB), which handled the Chinese economy’s rising demand for the commodity. Market intelligence estimated Liu’s short position at about 100,000 to 200,000 tons of copper.
•Copper prices climbed from 1,500 USD per ton in 2003 to almost 9,000 USD in 2006, and Liu, labeled as a rogue trader, vanished.
21 Zinc: Flotsam and Jetsam 2005
The city of New Orleans, called The Big Easy, is well known for its jazz, Mardi Gras, and Creole cuisine. Less well known, however, is that about one-quarter of the world’s zinc inventories are stored there. Hurricane Katrina’s flooding makes the metal inaccessible, and concerns over damage cause the price of zinc to rise to an all-time high.
“It’s totally wiped out . . . it’s devastating.” —President George W. Bush
Zinc, which is traded on the London Metal Exchange (LME) in US dollars per metric ton, is the third-largest metal market, after copper and aluminum. But in the first years of the new millennium, zinc and lead were considered the ugly sisters of copper and aluminum, because of years of low prices and low margins for mining companies. Global supply was stagnating.
What Happens at the LME?
At the London Metal Exchange (LME), copper, aluminum, zinc, lead, nickel, and tin, as well as molybdenum, cobalt, and steel are traded. To capture the opportunities of electrification and electronic vehicles, LME plans to introduce lithium, manganese, and graphite futures contracts in the near future. Trading takes place in two rounds, in the morning and afternoon, in an open ring (“open pit”) during which the daily official trading price is determined. In 2012 the 137-year-old LME agreed to a 1 billion GBP takeover from the Hong Kong Exchange and Clearing (HKEx) after a nine-month auction battle that included ICE, CME, and Nasdaq. With an annual turnover of more than 12 trillion USD, the London Metal Exchange is the world’s largest trading place for metals, followed by metal exchanges in Singapore and New York.
LME forward contracts are physically deliverable, and inventories of corresponding metals are stocked in LME-approved warehouses. Delivery takes place against LME delivery notes, which provide the owner with the right to a specified quantity of metal at a designated storage location. Currently, there are more than 400 warehouses in 32 locations, from the United States and Europe to the Middle East and Asia.
Even as interest in industrial metals increased in 2003 as a result of the rapid growth of the Chinese economy, zinc’s price rise lagged behind those of other industrial metals. Nevertheless, China played a major role in the metal’s shortage: In 2004 the country became a net importer of zinc, bringing in about 67,000 tons in the first seven months of 2005, after only 15,000 tons were imported in the entire previous year. The International Lead & Zinc Study Group forecast a market deficit of 200,000 metric tons by the end of 2005, though there had been an excess of 50,000 tons in the first five months.
Even though global inventories continued to decline, many producing companies remained skeptical about increasing the supply. “At this point, nobody in our business is rushing to build new zinc mines,” explained Greig Gailey, managing director of Zinifex, the world’s third-largest producer of zinc (after Xstrata and Teck Cominco), in 2005. “We’re certainly not, nor are Teck Cominco or Falconbridge.”

By this time the price of zinc was hovering around 1,200 USD per metric ton. It had broken through 1,000 USD at the beginning of 2004, after moving in a narrow range between 750 and 850 USD over the two previous years.
About 25 percent of global zinc inventories were concentrated in warehouses in and around New Orleans.
In a nutshell, that was the situation until August 2005. Then Katrina hit New Orleans like an atomic bomb. The Level 5 hurricane caused devastating damage in the southeastern United States but particularly affected the city, whose urban area was almost completely below sea level.
Twenty-four official LME warehouses had been sited in and around the city at the Mississippi Delta, due to its geographical location and attractive economic conditions. In addition to 250,000 tons of zinc, there were also 1,200 tons of aluminum and 900 tons of copper locked away. Global zinc inventories were estimated by the International Lead & Zinc Study Group to be just over 1 million metric tons at that point—the equivalent to a 35-day global supply. The inventories in New Orleans therefore accounted for around a quarter of global stocks and about half of the zinc traded at the LME. Due to the flood damage in New Orleans, however, access to the zinc was suddenly severely limited.
Stephen Briggs, a metal analyst at Société Générale, summarized the situation: “We have a potentially serious development . . . the market is assuming that the metal is damaged and will be inaccessible for a lengthy period of time.”
Who Needs Zinc?
Zinc is mainly used as corrosion protection for other metals or metallic alloys such as iron or steel, and most of the demand for it is based on infrastructure, construction, and transport. Zinc is commonly produced as a co-product with lead, and worldwide mined production is around 11 million metric tons. The largest producer countries are China, Australia, Peru, the United States, Australia, and Canada; the latter two are also the largest exporters of the metal. Unlike the more concentrated markets for copper or nickel, the 10 largest companies produce less than 50 percent of the world’s zinc.
Consumers assumed the worst. On September 2, zinc prices rose to a five-month high, as speculators foresaw delays in the delivery of zinc from the New Orleans warehouses. On September 6, the LME decided to temporarily suspend the supply of zinc from its stocks, though it had confirmed delivery of the metal just a week before. Accordingly, the price of zinc in London increased exponentially to 1,454 USD per metric ton, the highest since 1997. Two days later the LME’s CEO, Simon Heale, confirmed that suspension of deliveries could last until 2006 because of lack of access to the port of New Orleans.
At the end of the year, zinc prices broke through 1,900 USD and, just under two weeks later, reached 2,400 USD in London. But that was only the beginning: The worsening situation eventually drove the value of the metal to 4,000 USD in the first half of 2006 and marked a new high of just under 4,600 USD per ton in November of that year.
By 2007 the scare was over: Beginning in August, the price dropped continuously over the next 12 months, from 3,500 USD to less than 1,500 USD.
Key Takeaways
•Only market insiders were aware that warehouses in the city of New Orleans held around a quarter of global zinc stocks and about half of the zinc traded at the London Metal Exchange, the biggest physical metal market in the world.
•In August 2005 Hurricane Katrina devastated New Orleans, causing extensive flooding in the area and making zinc inventories inaccessible.
•As a consequence of this shortage of material, the price for zinc climbed from nearly 1,200 USD per ton during summer 2005 to a record of 4,600 USD in November 2006.
22 Natural Gas: Brian Hunter and the Downfall of Amaranth 2006
In the aftermath of the closure of MotherRock, an energy-based hedge fund, the bust of Amaranth Advisors shakes the financial industry, as it is the largest hedge fund failure since the collapse of Long-Term Capital Management in 1998. The cause? A failed speculation in US natural gas futures. Brian Hunter, an energy trader at Amaranth, loses 6 billion USD within weeks.
“The market can stay irrational longer than you can stay solvent.” —John Maynard Keynes
The news shook financial markets like an earthquake in September 2006: Amaranth Advisors, a 10 billion USD American hedge fund, erased around two-thirds of its capital in two weeks by betting on natural gas and was about to close. Only a few weeks before, MotherRock, another hedge fund that specialized in natural gas futures, had collapsed as well. Some of the causes for these events date back to previous years. Following the record hurricane seasons of 2004 and 2005, many hedge funds had become interested in the energy markets. Hurricanes Ivan, Katrina, Rita, and Wilma had all damaged crude oil and natural gas production facilities in the Gulf of Mexico, resulting in a significantly reduced supply.
Weather and hedge fund speculation drove up natural gas prices from 6 to above 15 USD.
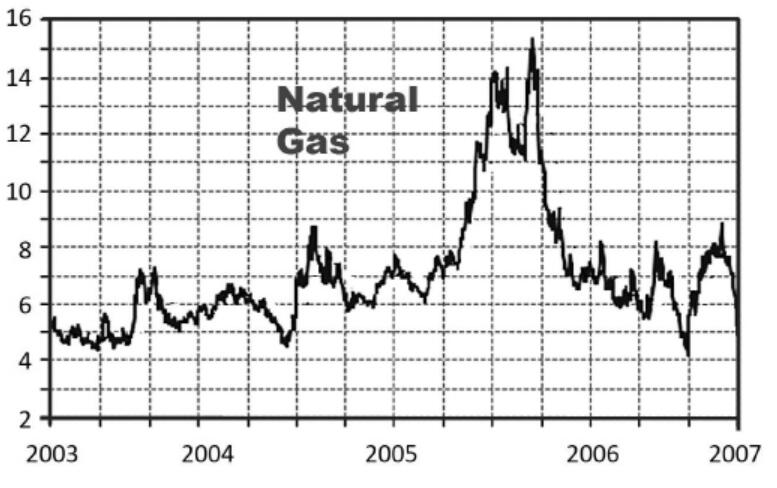
These extreme weather events, as well as relatively constant demand during the winter months, led to increasing price volatility and, in some cases, substantial price spikes for energy, especially natural gas. While the price of gas traded between 6 and 7 USD during 2004 and the first half of 2005, the hurricane season drove up gas prices to more than 15 USD in December. Production disruptions dragged on for months, but the warm winter, the absence of major storms, and a greater number of imports dampened the effect on the price level of natural gas in 2006.
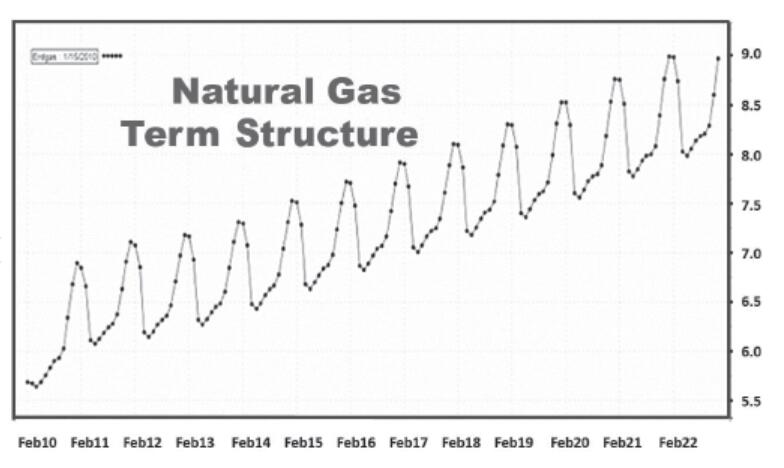
Compared to their all-time high that year, benchmark natural gas prices in New York lost around two-thirds of their value. In September natural gas was trading near 4 USD. The huge fluctuations in price made natural gas interesting for short-term-oriented traders, but natural gas’s future contract curve offered an even more interesting investment opportunity. Speculation on the change of price differences between different contract maturities is a popular trading strategy, especially by hedge funds: Traders enter long and short positions in the same commodity simultaneously, and the trade is based on an expansion or narrowing of the price differences, that is, a change in the steepness of the term structure.
Some Thoughts on Natural Gas
Natural gas is one of the most important sources of energy in the United States, with a market share of almost 25 percent. Home heating, electricity generation, and other industrial applications together make up nearly 80 percent of its use. But the need for heat, which accounts for 20 percent of total demand, is very seasonal: There’s high demand in the winter months, less during the summer.
Natural gas production in the United States is focused in Texas, the Gulf of Mexico, Oklahoma, New Mexico, Wyoming, and Louisiana. Texas and the Gulf region together contribute more than 50 percent of domestic output. Another 15-plus percent of total US natural gas consumption is imported from Canada or imported in the form of liquefied natural gas (LNG).
Natural gas is traded on NYMEX under the symbol NG and the current contract month in USD per 10,000 MMBtu (1 MMBtu equals 26.4 cubic meters of gas, based on an energy content of 40 megajoules/m3).
In 2006 the two top hedge fund investors in the US natural gas market were Brian Hunter, head of energy trading at Amaranth Advisors, a fund worth 9 billion USD, and Robert “Bo” Collins, chief executive of MotherRock, which oversaw about 400 million USD. The Mother Rock Energy Master Fund, which launched in December 2004, returned 20 percent to its investors in 2005.
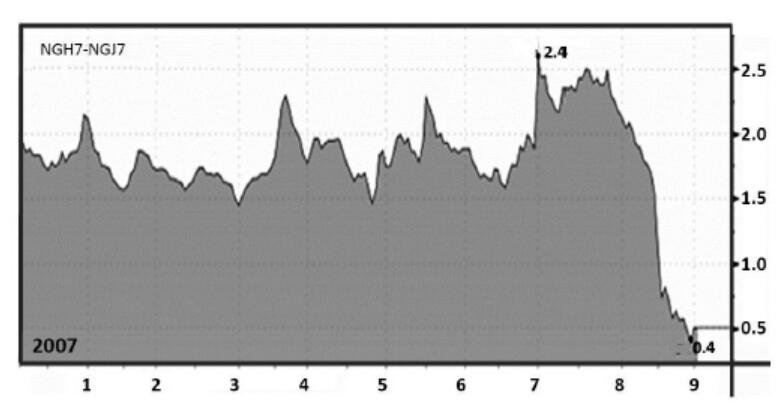
Some investors at the time were aware that Collins and Hunter held opposing positions in March–April and October–January natural gas contracts. In July 2006 the price difference between the gas futures for March and April 2007 reached 2.60 USD. Hunter’s investment decisions assumed that the difference would increase due to the upcoming cold season. In contrast, MotherRock was betting on a correction in the price spread.
Who Is Brian Hunter?
Born in 1975, Brian Hunter is a Canadian mathematician and hedge fund manager. From 2001 to 2004, he worked at Deutsche Bank in New York. There, in 2001 and 2002, he achieved a profit of 17 and 52 million USD by trading natural gas futures. However, after losses of more than 50 million USD in just one week, Hunter was released from his job. He moved on to Amaranth.
Hunter became a legend on Wall Street by earning more than 1 billion USD speculating on natural gas prices after Hurricanes Katrina and Rita. By August 2006 he had achieved a profit of about 2 billion USD. Within a week, however, he had lost three times that, causing serious problems for Amaranth. After his separation from the company, Hunter went on to found a new hedge fund in 2007.
Amaranth, with about 360 employees, had begun as a company that focused on convertible arbitrage. As those profit opportunities dwindled, it moved on to the energy sector. The firm dominated US natural gas trading on financial markets such as the NYMEX and the Intercontinental Exchange (ICE), as it bought and sold thousands of contracts, sometimes even tens of thousands, on a daily basis. Amaranth held about 100,000 natural gas contracts in one month, which accounted for about 5 percent of the total annual gas consumption of the United States. On the New York Stock Exchange alone, Amaranth controlled 40 percent of all outstanding contracts for the 2006–2007 winter season (October–March) and more than three-quarters of all outstanding November futures contracts.
Amaranth Advisors and MotherRock had opposite guesses on which way the market would move.
In June and July 2006, erratic natural gas price movements caused massive losses in the MotherRock Energy Master Fund. Earlier, the US Department of Commerce had reported a 12 percent increase in gas inventories. As a result, the gas price dropped by 12 percent within a week. The redemption of shares by investors aggravated MotherRock’s distress, which increased its losses to more than 200 million USD. However, the hedge fund’s high losses were not primarily due to a “normal” price decline. A subsequent Senate investigation confirmed that the sheer volume of Amaranth purchases of March contracts and sales of April contracts had distorted the price spread of natural gas, which moved up by more than 70 percent by July 31, 2006. MotherRock’s position worsened to the point where the fund was unable to meet its margin requirements. The fund collapsed, and positions were wound up in August 2006. Brian Hunter had triumphed, but his victory would be short lived.
In late summer, natural gas prices began a downward spiral. The price of natural gas on the NYMEX, with delivery in October, dropped from 8.45 USD in July to below 4.80 USD in September, the lowest price of the previous two and a half years. The difference between futures contracts maturing in March 2007 and April 2007 moved from a high of nearly 2.50 USD in June to below 50 US cents in September—a plunge of around 75 percent!
At the end of August, Amaranth held approximately 100,000 contracts in both the September and October futures on the long and short sides. Taken together, these represented enormous positions, because the movement of only 1 US cent on 100,000 contracts meant a change in value of about 10 million USD. The sheer size of the trades caused significant price movements in natural gas and its future term structure, that is, the price relationship of the different maturities.
The total positions of the fund added up to approximately 18 billion USD. The 60-cent increase in September contracts and the associated drop in the October–September price spread meant a huge loss for Amaranth.
On August 29 the profit-and-loss calculation showed a one-day depreciation of natural gas valuation of just under 600 million USD. The next day’s margin obligations would be even worse: They rose to 944 million USD, due to further price depreciation. Two days later Amaranth’s margin commitments were in excess of 2.5 billion USD. A week later, on September 8, the hedge fund’s obligations exceeded 3 billion USD.
Amaranth’s total positions added up to 18 billion USD. In September the fund’s margin commitments rose to more than 3 billion USD.
With the price volatility of energy markets remaining high, and because of the cumulative losses, concerns were mounting at Morgan Stanley (one of Amaranth’s important investors, along with Credit Suisse and Deutsche Bank), which forced the fund to return money.
Funds under management at Amaranth fell from 9 to 4.5 billion USD in just a week. Founder Nicholas Maounis told his investors in a letter that the company would drastically reduce its positions due to the price fluctuations in the US gas market, and that investors could anticipate losses of 35 percent by the end of the year, even though four weeks earlier the fund had posted a 26 percent profit.
Amaranth got its name from the Greek word for “imperishable,” but it was now painfully clear that the firm’s profits were anything but. In addition to individual investors, injured parties included umbrella hedge funds of Credit Suisse, Morgan Stanley, and Deutsche Bank. On July 25, 2007, the Commodity Futures Trading Commission condemned Amaranth and Brian Hunter for attempted price manipulation of the natural gas market. Hunter, who had left Amaranth, had already established a new hedge fund—Solengo Capital Advisors.
When Amaranth collapsed in September 2006, investors were told redemptions would be temporarily suspended. Ten years after the blowup, in 2016, Amaranth investors were still waiting to get their money back.
Key Takeaways
•Energy markets were a hot topic in 2005–2006. The price of natural gas climbed from 6 to more than 15 USD, but in late summer the market turned sour and a downward spiral began. In September 2006 natural gas fell below 5 USD.
•Brian Hunter built a position of 18 billion USD in natural gas. By August 2006 his trades had earned him 2 billion USD. But then the market turned against him. Within weeks he had lost 6 billion USD, and Amaranth Advisors collapsed in September 2006.
•The demise of Amaranth Advisors shook the financial industry. It was the biggest hedge fund collapse since the downfall of Long-Term Capital Management in 1998 and investors haven’t been paid back yet.
23 Orange Juice: Collateral Damage 2006
“Think big; think positive. Never show any sign of weakness. Always go for the throat. Buy low; sell high.” That’s the philosophy of Billy Ray Valentine, played by Eddie Murphy in the 1983 movie Trading Places. The film’s final showdown has Murphy and Dan Aykroyd cornering the orange juice market. In reality, the price of frozen orange juice concentrate would quadruple between 2004 and 2006 on the New York Mercantile Exchange—a consequence of a record hurricane season.
“My God! The Dukes are going to corner the entire frozen orange juice market!” —Dan Aykroyd, as Louis Winthorpe III in Trading Places
The blockbuster movie Trading Places, from 1983, stars Eddie Murphy and Dan Aykroyd and culminates in a chaotic scene at the New York commodity exchange over trades of orange juice that hinge on data from the US Department of Agriculture. This was not really farfetched, as trading in orange juice, or more precisely frozen orange juice concentrate, on the New York Mercantile Exchange (NYMEX) is dominated by the effects of weather. Hurricanes, frosts, or droughts in Florida and the region around São Paulo, Brazil—the main places where oranges are grown—can lead to major price fluctuations that vary with the seasons and also affect other agricultural commodities: High prices are due to risk premiums in May (frost in Brazil) and November (hurricane season in Florida), and lows are more common in February and September. Even light storms can lead to a loss of fruit.
Some Juicy Facts
Oranges are cultivated in almost all parts of the world with tropical or subtropical climates, but two countries dominate orange juice production. More than 50 percent of the world’s harvest comes from Brazil (the São Paulo region) and Florida in the United States. At harvest, oranges are typically packaged in boxes of 90 pounds or 40.8 kilograms. Processing fruit into concentrate offers advantages, compared to oranges and orange juice, when it comes to storage, shelf life, and transportation.
Orange juice is traded in the form of frozen concentrated orange juice futures in New York. A futures contract refers to 15,000 pounds of concentrate, the equivalent of 2,300 to 2,500 boxes of oranges. Under normal conditions, an orange harvest in Florida provides about 200 million boxes, worth about 1.2 billion USD.
The hurricane seasons of 2004 and 2005 were the most active since weather records were kept in the United States.
Heavy storms can destroy entire plantations and, at worst, result in lower harvests for several years, because new crops do not bear fruit for three to four years and are most productive only after about eight years. Storms can also make a difference in the spread of pests and diseases, which can greatly impact harvests on monoculture plantations. The years 2004 to 2006 created a “perfect storm” for the price of orange juice, overshadowing even the price spike of crude oil during the 2005 hurricane season.
Storms to Remember
The Atlantic hurricane season typically lasts from June 1 to November 30, and an average season sees just six hurricanes. There are exceptions: The year 2004 was one of the most active and costly hurricane seasons since records began. Winds and floods were responsible for at least 3,000 deaths and property damage of approximately 50 billion USD. The most significant storms—Charley, Frances, Ivan, and Jeanne—all crossed the United States. And all four hit Florida.
But the hurricane season of 2005 stands out even more. It emerged as the most active hurricane season since weather records began, with 28 storms, including 13 hurricanes, of which 4 were Category 5 storms! Category 5 on the Saffir-Simpson scale means a hurricane with wind speeds in excess of 251 km/h. The storms in 2005 cost some 2,300 lives and caused damages amounting to 130 billion USD. Hurricanes Dennis, Emily, Katrina, Rita, and Wilma were responsible for the worst of the devastation that year. Katrina caused massive damage in the southeastern United States in August 2005, hitting the city of New Orleans particularly hard. However, Wilma broke all records and is now considered the strongest storm in history.
Florida’s orange industry generally has suffered from subsidized overproduction. As a result, in times of good harvests income levels are low. The orange harvest in 2004 was very productive, and consequently in May 2004 the price of orange juice was about 35 percent lower than in the previous year. The US Department of Agriculture was estimating a harvest of 245 million cases in 2004, which would have been well above the crop level of the previous year (203 million cases) and would even have topped the record harvest of the 1997–1998 season (244 million cases). In addition, the Atkins diet, which advocated avoiding carbohydrates (including the sugar in orange juice), was particularly popular in the United States at the time and causing noticeably lower demand. At the end of May 2004, orange juice was trading at only 0.54 USD/lb in New York.
But then parameters started to change. The Atkins diet lost popularity, and demand began to pick up. And four hurricanes in 2004–2005—Charley, Frances, Jeanne, and Wilma—would affect the supply of Florida oranges. According to the Florida Citrus Mutual industry association, Hurricane Wilma alone caused a crop loss of around 35 million boxes, or about 17 percent of unharvested fruit.
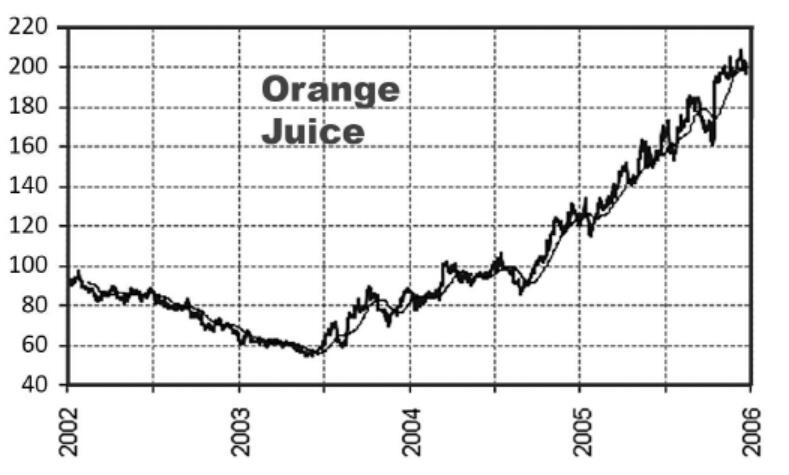
From a base of 0.55 USD, the price for frozen orange juice concentrate rose to more than 2 USD. A quadruple increase!
In 2005 the US Department of Agriculture predicted a harvest of only 135 million boxes, that is, a decline of almost 10 percent compared to the already-below-average harvest of the previous year. Market observers expected the lowest harvest level in the previous 17 years due to storm damage and pest infestation. Starting at just under 0.55 USD in May 2004, the price of orange juice concentrate in New York continued to rise, quadrupling within two and a half years.
The prices for orange juice rose to levels unmatched since 1990.
In October 2005 the price rose above 1 USD, breaking a psychological barrier, and the upward momentum continued. Orange juice rose to levels that had not been reached since January 1990, when the price topped 2 USD after a severe frost. In December 2006 the price of orange juice was again trading above 2 USD.
The orange crop in 2005–2006 began to recover slightly in both the United States and Brazil compared to the previous year. But the supply remained about 30 percent below the 2003–2004 level. Finally, in 2007, the price for orange juice fell back to between 1.20 and 1.40 USD, and in 2008, the price normalized to levels below 1 USD again.
Key Takeaways
•Prices of agricultural commodities are very sensitive to extreme weather. As a consequence of a record Atlantic hurricane season, the price of frozen orange juice concentrate quadrupled between 2004 and 2006.
•In October 2005 prices surpassed 1 USD and continued to climb. In December 2006, the price of orange juice traded above 2 USD, a level that had not been reached since January 1990.
•A notable fictional cornering of the market for frozen orange juice concentrate—whose plot hinged on weather information from the US Department of Agriculture’s Crop Report—took place in the movie Trading Places (1983), starring Eddie Murphy and Dan Aykroyd.
24 John Fredriksen: The Sea Wolf 2006
John Fredriksen controls a corporate empire founded on transporting crude oil. Among the pearls of that empire is Marine Harvest, the largest fish-farming company in the world.
“You stand on dead men’s legs. You’ve never had any of your own. You couldn’t walk alone between two sunrises and hustle the meat for your belly . . .” —Jack London, The Sea Wolf
Acomparison with socialite Paris Hilton is inevitable: The twin sisters Kathrine and Cecilie, 26, are young, beautiful, and rich. In the list of Forbes magazine’s “Hottest Billionaire Heiresses,” the twins are next to Ivanka Trump and Holly Branson. The sisters have so far kept their names out of scandals, but they are already following in the business footsteps of their father, John Fredriksen. Forbes rates the private wealth of the 74-year-old Norwegian shipowner—by far the richest Norwegian—at more than 8 billion USD. Due to high taxes in Norway, however, Fredriksen lives in London and holds Cypriot citizenship.
Fredriksen, born May 11, 1944, near Oslo, became rich in the crude oil business, as have many before him. He was already working in the shipping business when he set up his own company during the oil crises of the 1970s and built up a tanker fleet, today one of the largest in the world. He earned money on risky ventures during the Iran-Iraq War in the 1980s and delivered crude oil to the apartheid regime in South Africa.
Today Frederiksen heads a huge corporate empire, directly or through its investment firms. He is the largest shareholder of the Bermuda-registered shipping company Frontline, which controls a fleet of Liquefied Natural Gas (LNG) tankers with Golar LNG, and is involved in the oil rig operator SeaDrill and the shipping companies Golden Ocean Group and Overseas Shipholding Group. In Germany, Fredriksen is known as a major shareholder of the TUI Group and an advocate of selling the container shipping division Hapag-Lloyd, in order to promote the consolidation of the industry. Prior to 2010 John Fredriksen held the largest stake in TUI Travel and had a significant influence upon its direction and strategy. The Norwegian had already made a name for himself in the world of fish farming and today controls the largest fish-farming company in the world—Marine Harvest.
In the 1971 German TV adaptation of Jack London’s famous adventure novel The Sea Wolf, Raimund Harmstorf, in his role as Wolf Larsen, crushes a raw potato to illustrate his worldview—eat, or be eaten. It’s an apt metaphor for the dealings of John Fredriksen, the Norwegian Sea Wolf.
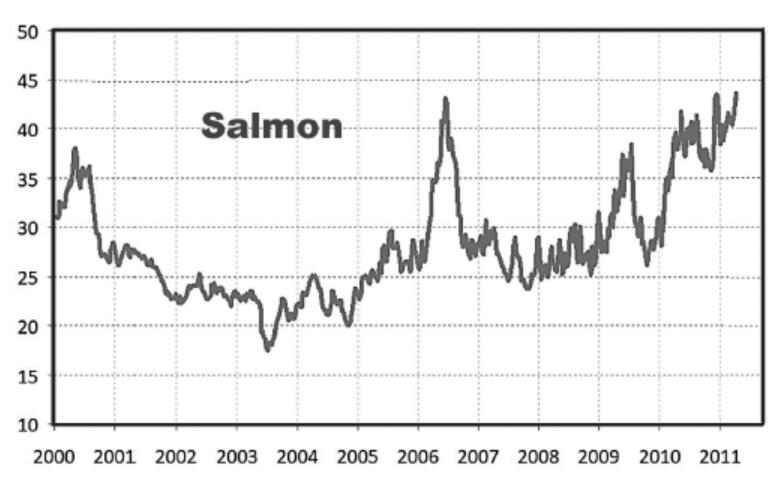
In the first years of the new millennium, the Norwegian fish-farming industry was experiencing financial difficulties due to low prices for fish. In particular, the company Pan Fish, founded in 1992, had been struggling since 2000.
What’s the Catch?
By far the world’s largest fishing nations are China, Peru, India, and Japan. In Europe, Norway, Denmark, and Spain haul in the largest harvests. The value of world exports of fish and fishery products in 2015 reached 96 billion USD. Aquaculture deals with the controlled cultivation of fish, mussels, crabs, and algae, and there’s a rapidly growing global market for these products: According to figures from the UN’s Food and Agriculture Organization (FAO), slightly more than a third of the almost 150 million metric tons of fish caught come from aquaculture—and the number is rising. The Organisation for Economic Co-operation and Development (OECD) and FAO estimate that by 2020 the proportion of farmed fish will account for almost 50 percent of the total fishery.
Farmed fish have the advantage of lower prices, and some argue that fish farms can also counteract the overfishing of the oceans; according to FAO estimates, more than 70 percent of the fishing grounds are already considered “overfished.” However, others point out some disadvantages: Aquaculture’s carnivorous fish, such as salmon and trout, consume many times the body weight of wild-caught fish; and there are particularly negative consequences to keeping fish in unnaturally large and dense pens, especially in countries with low ecological standards, such as in Southeast Asia or South America, because of over-fertilization or the use of antibiotics.
Fredricksen controlled an almost 50 percent stake in Pan Fish through his investment company Greenwich Holding and the two vehicles Geveran Trading and Westborough Holdings. In June 2005, he bid successfully for the remaining shares of the company. In the second quarter of 2005, Fredriksen also acquired 24 percent of Fjord Seafood through Geveran Trading. His shares would soon amount to nearly 50 percent of the company. Then, in October 2005, Fjord Seafood made an offer to the state fish-farming company Cermaq, but the bid failed due to opposition from the Norwegian government.
Fredricksen made his next big move in March 2006: Nutreco, today the largest manufacturer of fish feed worldwide, sold 75 percent of Marine Harvest—which had been involved in Chilean fish farming since the mid-1970s—to Geveran Trading for nearly 900 million euros. The remaining 25 percent was acquired by the Norwegian firm Stolt-Nielsen.
On December 29, 2006, Pan Fish, Fjord Seafood, and Marine Harvest merged to form the new Marine Harvest Group. What was by far the largest fish-farming corporation in the world was now under the control of John Fredriksen.
Key Takeaways
•John Fredriksen, a modern version of Jack London’s Sea Wolf, made his fortune in the crude oil market, then became active in oil drilling, the transport of crude oil, shipping, and liquified natural gas. Today he controls an extensive corporate empire.
•During the first years of the new millennium, the Norwegian fish-farming industry experienced severe financial difficulties due to low salmon prices.
•By active industry consolidation over two years, Fredriksen built the Marine Harvest Group in 2006. Today it’s the world leader in fish farming and aquaculture.
25 Lakshmi Mittal: Feel the Steel (2006)
The dynamic growth of the Chinese economy and its hunger for raw materials rouses the suffering steel industry from near death. Through clever takeovers and the reorganization of rundown businesses, Lakshmi Mittal rises from a small entrepreneur in India to the largest steel tycoon in the world, a position he crowns with the acquisition of his main competitor and the world’s second-largest steel producer—Arcelor.
“I want to be the Ford of Steel.” —Lakshmi Mittal
“Aim for the highest.” —Andrew Carnegie
It was a dream wedding, with a setting akin to the court of ancient maharajahs in India or a tale from 1001 Nights. On June 22, 2004, fireworks illuminated the night sky in Paris, Bollywood stars Aishwarya Rai and Shah Rukh Khan entertained the guests, pop star Kylie Minogue performed, and more than 5,000 bottles of Mouton-Rothschild 1986 were served. The evening festivities were the main attraction of the six-day celebration of the wedding of 23-year-old Vanisha Mittal and London investment banker and founder of Swordfish Investments Amit Bhatia, age 25. Twelve Boeing jets had been chartered to bring more than 1,500 guests from India to France, where they visited the Jardin des Tuileries, Versailles, and the Château de Vaux-le-Vicomte. The silver-wrapped wedding invitations included five-star accommodations at the Hotel Le Grand and the InterContinental, whose 600 rooms had been fully booked. Presents for the guests featured designer handbags filled with jewelry. It is estimated that the cost of this extravaganza was around 60 million USD. The check was signed by the proud bride’s father, Lakshmi Mittal.
Who is this tycoon who could arrange a fairytale wedding for his daughter and that same year acquire a princely residence in London’s posh Kensington district from the chief executive of the Formula One Group, Bernie Ecclestone, for the equivalent of around 130 million USD?
Lakshmi Mittal’s father had run a small steel plant in the Rajasthan province of India. The family later moved to Calcutta, where the father took over a major factory and where Lakshmi learned the steel business from scratch.
After studying business administration in Calcutta, in 1976 Lakshmi was put in charge of modernizing a rundown steelwork in Indonesia that the family had previously acquired for 1.5 million USD. That pattern would continue throughout the Indian mogul’s life, as he bought money-losing or underutilized steel producers and restructured their business through cost reductions, sales orientation, layoffs, and closures. When a steel industry boom was triggered by rapid economic growth in China, Lakshmi Mittal would become one of the richest men in the world in just a few years.
Lakshmi Mittal forged the world’s largest steel company.
Gradually he added larger and larger acquisition targets. In 1989 Mittal bought a derelict steel plant in Trinidad and Tobago and renovated it. He had a major success in Mexico in 1992: The state had invested 2.2 billion USD in state-of-the-art steel-production equipment, but the end of the oil boom was forcing the government to sell. Mexican president Carlos Salinas awarded the Indian entrepreneur the contract for just 220 million USD, of which Mittal only had to raise 25 million in cash. He then renamed the company Ispat Mexicana. (Ispat is Hindi for “steel.”)
The year 1995 marked another turning point for the businessman. After the collapse of the Soviet Union, the giant Karmetwerk, which included coal mines, was up for privatization in Kazakhstan. Although Western corporations did not dare invest, Mittal paid 400 million USD, dismissed a third of the workforce, and made the company profitable within a year. Mittal also bought Sidex in Romania after that company was privatized, though it was a controversial deal because of a letter of recommendation written by British prime minister Tony Blair to Romanian president Adrian Năstase after Mittal’s donation to Blair’s party (“Mittalgate”).
Mittal Steel was created in the spring of 2005.
In October 2004 Mittal announced the merger of privately held LNM Holding and publicly listed Ispat International with the American International Steel Group (ISG). (ISG arose from the assets of LTV Steel and the assets of former industrial titans Acme Steel and Bethlehem Steel.) In the spring of 2005, the deal—worth 4.5 billion USD—was concluded. Mittal Steel, based in the Netherlands, was born.
Steel Ups and Downs
Carnegie and Vanderbilt in USA, or Thyssen and Krupp in Germany—these family names ring a bell in the history of the steel industry. Compared to other industries, the steel industry today is highly fragmented; the 10 largest steelmakers produce less than a third of the world’s supply, compared to a market share of more than 90 percent by the world’s 10 largest carmakers. ArcelorMittal is the industry leader. Nippon Steel, Baoshan Iron & Steel, POSCO, and JFE Steel follow at some distance.
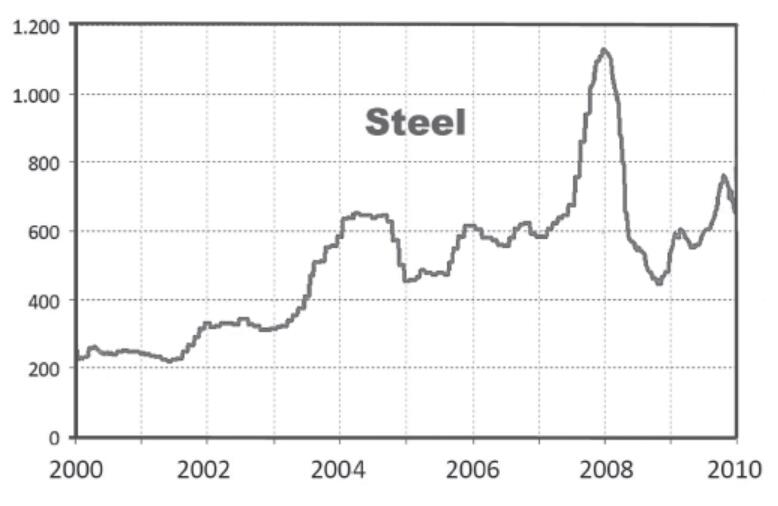
The 1990s were dark years for steel producers from Western countries. Specifically, the US steel industry slipped into a severe crisis due to overcapacity and cheap imports, and since the late 1990s, more than 30 companies have had to apply for bankruptcy and creditor protection. The situation changed dramatically with the rapid growth of the Chinese economy. The Chinese demand for steel increased from around 15 percent of the world’s market in 2000 to almost 50 percent a decade later. This unbalanced the markets for raw materials like iron ore and metallurgical coal and caused prices for crude steel to rise significantly. At the beginning of the millennium, the price for a metric ton of steel was around 200 USD; by 2008, it had risen to 1,100 USD.
Mittal had created the world’s largest steel producer, with more than 70 million tons of production capacity. About 90 percent of the company was owned by the family. But Mittal, who wanted to outdo magnates like Andrew Carnegie and Bethlehem Steel’s Charles Schwab, was not yet satisfied.
In October of the same year, Mittal Steel acquired Ukrainian steel producer Kryvorizhstal at an auction for 4.8 billion USD, after the Ukrainian president decided against a consortium headed by the son-in-law of the former Ukrainian president. But behind the scenes a much larger deal was looming that would profoundly change the steel industry.
In January 27, 2006, Mittal announced a takeover bid to the shareholders of Arcelor, which was the industry’s second-biggest company. He offered a premium of 27 percent on the closing price of the previous day, a purchase price of nearly 20 billion USD. Arcelor itself had been created by the merger of French, Spanish, Luxembourg, and Belgian steelworks, and in 2005 it had produced almost 50 million metric tons of crude steel. The attempt at the hostile takeover provoked Arcelor’s corporate leadership; the governments of Luxembourg, France, and Belgium also opposed the merger.
“L’India”—the Indian—“does not fit in with our great culture,” said Guy Dollé, the French head of Arcelor. And, in fact, the takeover battle turned into a war of cultures, during which Arcelor sought to save itself through a merger with Russian steelmaker Severstal. It played out like high-stakes poker. In the course of a month, Arcelor rejected two offers from Mittal as too low. Then, in June 2006, the Arcelor board of directors called for a marathon nine-hour negotiation. For almost 34 billion USD, a further premium of 15 percent on the stock closing price of the previous day—about 45 percent above the original offer—Arcelor finally agreed to the sale.
With the merger of Arcelor and Mittal, the world’s largest steel producer was created, with a combined production volume of just under 120 million tons of crude steel, a global market share of around 12 percent, 60 billion USD in sales, and more than 320,000 employees. Number two in the industry, Nippon Steel, had less than one-third of ArcelorMittal’s production capacity.
With the acquisition of Arcelor, the Mittal family reduced its stake in the new company to around 45 percent. Nevertheless, with estimated private assets of around 25 billion USD, Lakshmi Mittal is considered the fifth richest person in the world.
Key Takeaways
•The awakening of the Chinese economy, with its dynamic growth and enormous lust for resources, shook up a moribund global steel industry. Between 2000 and 2008, global steel prices increased more than fivefold. One entrepreneur noticed this industry trend faster than others.
•Lakshmi Mittal became the “man of steel.” The Indian tycoon created Mittal Steel in 2005 by buying ISG and the remaining assets of former US industry giants Acme Steel and Bethlehem Steel. But that was not enough. After a bidding frenzy, in summer 2006 Mittal bought Arcelor and forged the world’s biggest steel company, ArcelorMittal.
•After the transaction was complete, Lakshmi Mittal was considered the fifth richest person in the world, with estimated private assets topping 25 billion USD.
26 Crude Oil: The Return of the “Seven Sisters” (2007)
An exclusive club of companies controls oil production and worldwide reserves. But its influence diminishes with the founding of the Organization of the Petroleum Exporting Countries (OPEC) and the rise of state oil companies outside the Western world.
“There is no business like oil business.“ —C. C. Pocock, Chairman of Shell
In 2007 the Financial Times created the term the “New Seven Sisters” to describe the world’s seven most influential energy companies outside the Organisation for Economic Co-operation and Development (OECD). The original Seven Sisters, a term coined in the 1950s, referred to a consortium of predominantly successor companies to the Standard Oil Company: Standard Oil of New Jersey, Standard Oil Company of New York, Standard Oil of California, Gulf Oil, Texaco, Royal Dutch Shell, and the Anglo-Persian Oil Company.
For a long time, the Seven Sisters were regarded as the dominant force in the oil business, since, thanks to a framework agreement with the Iranian government, they held a demand cartel over oil producers in the Third World. Producer countries were forced to sell the majority of their production on the basis of long-term contracts and fixed prices to the oligopoly, which also controlled trade and distribution.
The Seven Sisters were able to set the rules, because until the 1970s the group controlled about 85 percent of global oil reserves. However, early in that decade, more and more important producer countries began to nationalize their oil industry: Algeria was the first country to do so, in 1971, followed shortly thereafter by Libya. In the following year, Iraq nationalized the concessions of Western companies. In 1973 Iran also nationalized its domestic oil industry. The power of the Seven Sisters was dwindling, and OPEC—founded in 1960 and the cartel’s counterpart on the supply side—was gaining in importance.
The Seven Sisters controlled 85 percent of the world’s oil reserves until the 1970s.
Today, OPEC countries supply about 40 percent of the world’s crude oil, and according to their own data, member countries together account for about 75 percent of global crude oil reserves, while oil production in Western countries has declined over recent years.
Four of the Seven Sisters still exist today—ExxonMobil, Chevron, Royal Dutch Shell, and BP.
To counter strong price fluctuations and a continuous drop in oil prices below 10 USD, the large oil companies used mergers and acquisitions. For example, Exxon (Standard Oil of New Jersey) and Mobil Oil (Standard Oil Company of New York) merged in 1999 to create ExxonMobil, the world’s largest oil company, whose annual revenue exceeds the economic power of many small countries.
From Standard Oil of California came Chevron, which took over US Gulf Oil in 1985 and in 2001 incorporated Texaco as well. The British Anglo-Persian Oil Company first became the Anglo-Iranian Oil Company and then British Petroleum. Following the acquisition of Amoco (the former Standard Oil of Indiana) and Atlantic Richfield, the company finally changed its name to BP in 2000. As a result, four of the original seven dominant companies were left: ExxonMobil, Chevron, Royal Dutch Shell, and BP.
Big Oil today is made up of BP, Chevron, ConocoPhillips, ExxonMobil, Royal Dutch Shell, and Total.
Further mergers, such as Total and Petrofina (1999), Total and Elf Aquitaine (2000), and Conoco and Phillips Petroleum (2002), have put the US firm ConocoPhillips and the French company Total into the same category as the other four. There are now six super-majors—BP, Chevron, ConocoPhillips, ExxonMobil, Royal Dutch Shell, and Total—all often referred to as “Big Oil” in the financial press. However, their influence today is significantly lower than that of the Seven Sisters 50 years ago. Together, Big Oil today controls less than 10 percent of global oil and gas production, and the group’s share of global reserves is again significantly lower.
In contrast, the “new Seven Sisters” of the oil industry together control about a third of global oil and gas production and global reserves: These include Saudi Aramco (Saudi Arabia), Gazprom (Russia), China National Petroleum Corporation (China; CNPC), National Iranian Oil Company (Iran), Petróleos de Venezuela (Venezuela), Petrobras (Brazil), and Petronas (Malaysia).
The “new Seven Sisters” are Saudi Aramco, Gazprom, CNPC, National Iranian Oil, Petróleos de Venezuela, Petrobras, and Petronas.
Aramco, based in Dhahran, Saudi Arabia, is the most important of the group. As the world’s largest oil company, it produces 12 million barrels of crude oil daily and has reserves of approximately 260 billion barrels of crude oil—almost a quarter of global reserves. With its Ghawar oil field, Saudi Aramco also operates the largest oil field in the world. After a dramatic drop in oil prices in 2015–2016, the kingdom of Saudi Arabia speculated about an IPO of Saudi Aramco to raise money. But plans have not yet been realized.
At the end of 2006, Russian Gazprom and Petro China, a subsidiary of CNPC, had left the market value of most Western energy companies far behind. CNPC, the China National Offshore Oil Corporation (CNOOC), and Sinopec are China’s three largest oil companies.
The power of the former Russian state-owned company Gazprom—the world’s largest producer of natural gas—was felt in Europe in late 2005 due to the gas dispute with Ukraine. (The enterprise also holds a monopoly on the export of gas from Russia.)
The state-owned National Iranian Oil Company (NIOC), based in Tehran, is part of the Iranian Ministry of Petroleum and is also active worldwide. Petróleos de Venezuela (PDVSA) was the instrument of power of former Venezuelan president Hugo Chávez. Established as part of the nationalization of the country’s oil industry, PDVSA is today the largest oil company in Latin America. In the Campos Basin, the semipublic Petrobras (formally Petróleo Brasileiro) accounts for more than 80 percent of Brazil’s oil production. The company is also a leader in offshore drilling and deep drilling. With the Tupi field, the Brazilians have probably discovered the third-largest oil field in the world. Petronas (full name Petroliam Nasional Berhad), a state-owned petroleum company known for its landmark Petronas Towers in Kuala Lumpur, is one of the largest international oil and gas companies, with more than 100 subsidiaries and representations in more than 30 countries.
Key Takeaways
•After the breakup of Rockefeller’s Standard Oil empire, a consortium known as the “Seven Sisters” emerged. Included were Standard Oil of New Jersey, Standard Oil Company of New York, Standard Oil of California, Gulf Oil, Texaco, Royal Dutch Shell, and the Anglo-Persian Oil Company. This consortium controlled 85 percent of global crude oil reserves until the mid-1970s.
•The influence of the Seven Sisters diminished with the founding of OPEC and the rise of state oil companies outside the Western world. OPEC today controls about 40 percent of global oil and gas production.
•The legacy of the Seven Sisters lives on in a group of super-majors, six integrated oil and gas companies also referred to as “Big Oil”: BP, Chevron, ConocoPhillips, ExxonMobil, Royal Dutch Shell, and Total. Compared to the original Seven Sisters, they control less than 10 percent of global oil and gas production.
•The “new Seven Sisters” are Saudi Aramco, Gazprom, CNPC, National Iranian Oil, Petróleos de Venezuela, Petrobras, and Petronas. Together these seven companies control about a third of global oil and gas production and reserves.
27 Wheat and the “Millennium Drought” in Australia 2007
After seven lean years for Australia’s agricultural sector, a Millennium Drought drives the price of wheat internationally from record to record. Thousands of Australian farmers expect a total failure of their harvest. Is this a preview of the effects of global climate change?
“This is more typical of a 1 in a 1000-year drought, or possibly even drier, than it is of a 1 in a 100-year event.” —David Dreverman, Head of the Murray-Darling Basin Authority
The Aboriginal term uamby means “where the waters meet,” except that on the Uamby farm, 50 kilometers northwest of the Australian wine-making and sheep-breeding city of Mudgee, no more water was flowing. The year 2006 was one of the hottest since weather records began on this continent and also one with the least rainfall.
Though the extreme drought had already affected the farm severely, it was only the beginning of the worst summer months—which fall between December and March in Australia. Water reserves were running low, and the animals could no longer find food. The pastures were bare and parched, necessitating purchases of water and food. Of the original 4,800 sheep on the farm, only 2,800 were left; the remainder had to be sold for 5 USD per animal, though the owners had expected about 40 USD.
The World’s Wheat
With an annual production of just under 600 million tons, various wheat varieties, together with corn and rice, are among the most widely cultivated cereals in the world. Wheat accounts for around one-fifth of the world’s calorie needs. It’s an important food for livestock and is also used to produce biofuels like ethanol. The average yield per hectare is just under 3 tons worldwide (1 hectare = 10,000 square meters, comparable to a soccer field). Large parts of the harvest are consumed by the producer countries themselves, so that only about 100 million tons of the total amount produced reach the world market—a factor that can affect price fluctuations in times of shortages.
More than 400,000 people were working in Australia’s agriculture sector, one of the country’s most important industries, and the situation was dire. At the beginning of 2007, due to the adverse circumstances, a farmer was taking his own life every four days. At the beginning of the next year, more than 70 percent of the agricultural land, about 320 million hectares, was affected by lack of rain and high temperatures.
The “granary” of Australia, the Murray-Darling Basin, produces 40 percent of the country’s wheat.
The situation was especially tense in the Murray-Darling Basin. The river system spans thousands of kilometers, an area about the size of France and Spain combined, supplying some 15 percent of Australia’s water. Officially, the rivers supplied around 50 percent less water in 2007 than the previous year, and 2006 itself had been a record low-water year. The basin is considered the granary of Australia, because this area alone grows 40 percent of the food on the continent. Meanwhile, small towns like Dimboola, about 330 kilometers from Melbourne, in the Australian wheat belt, were becoming ghost towns.
For the international market, Australia’s role as the second-largest exporter of wheat was of particular importance. In “normal” times, Australia exports 25 million tons every year. But normal times had not existed in Australia for seven years, making the drought the country’s longest. The year 2006 was the third-driest year since records began in 1900, and the Australian Bureau of Agricultural and Resource Economics (ABARE) was estimating the 2006–2007 winter harvest at just 26 million metric tons, 36 percent less than the previous year. Even so, 2007 proved to be hotter, and experts began talking about a Millennium Drought. Australian prime minister John Howard declared it “the worst drought in living memory.” The direct cause was the phenomenon known as El Niño—a rise in Pacific Ocean temperature that affects weather patterns, and a phenomenon whose frequency and intensity has increased significantly through global climate change, according to environmental and weather experts.
El Niño Acts Up
El Niño (“the boy” in Spanish, referring to the Christ Child, since El Niño usually occurs around Christmastime) describes a weather phenomenon in which the sea surface temperature in the equatorial Pacific rises, wind systems over the Pacific change, and as a result, the cold Humboldt current west of South America weakens. A layer of warm water travels through the tropical East Pacific from Southeast Asia to South America, and water temperatures off Australia and Indonesia drop. The result is a change in global weather patterns: There are usually heavy rains on the South and North American West Coasts and drought, crop failures, and bush fires in Australia, India, and Southeast Asia.
In contrast, La Niña (“the girl”) is an exceptionally cold current in the equatorial Pacific, whose effects are excessive rain in Indonesia and drought in Peru.
The Australian harvest was crucial because the global 2006–2007 wheat harvest, at 598 million metric tons, was also significantly lower than the previous year’s 621 and 628 million tons. The 15 largest producing countries provided about 80 percent of that total. Australia, the second-largest exporter after the United States at the time, accounted for about 16 percent of global wheat exports.
The harvest came at a time of increasing demand, growing prosperity, and robust economic growth. For global wheat consumption, the forecast for this period was 611 million metric tons.
The collapse of Australian wheat production first hit Asia and the Middle East, since these countries traditionally imported grain from Australia. They were now looking for wheat in the United States and Canada. The Europeans were also affected by the heat. In Ukraine, the 2006 crop had shrunk by half.
In February 2008 the price for wheat more than tripled, compared to 2006, to almost 13 USD per bushel.
The price of wheat on the Chicago Board of Trade (CBOT) soon began an unprecedented rally. The typical trading band for wheat in the years before 2006 was between 2.50 USD and 4 USD. At the beginning of 2004, however, inventories fell to their lowest levels since 1980. Bad harvests in Europe and China meant that the Middle Kingdom had to import wheat for the fourth year in a row. The price of grains was picking up dynamically.
In October 2006, wheat broke through the 5 USD mark for the first time and remained there. Then, in June 2007, wheat prices rose to 6 USD, climbed to 7 USD in August, 8 USD at the beginning of September, 9 USD at the end of that month, and rose to 9.50 USD at the beginning of October.
Meanwhile, global inventories continued to fall and reached a 26-year low. In addition, in Canada—another major wheat exporter on the world market—grain reserves plunged 29 percent year-on-year at the end of July, while Egypt, Jordan, Japan, and Iraq placed buying orders for large quantities of wheat.

After this fast-paced rally, international wheat prices took a breather, but in hindsight that turned out to be just a short break. At the beginning of February 2008, wheat prices broke through the 10 USD barrier, and the price momentum continued. The closing price on February 27, 2008, was 12.80 USD, a dramatic tripling since early 2006!
The devastating drought had caused losses of around 50 percent in the recent Australian harvest. The situation began to relax slightly with the 2007–2008 harvest of 609 million tons, as the rapid increase in wheat prices had proved an incentive for many farmers to plant previously fallow land. A harvest of 688 million tons worldwide was estimated for 2008–2009. By then the unprecedented Australian drought finally had come to an end. However, weather experts painted a bleak picture for the country’s agriculture in the future.
Key Takeaways
•The year 2006 was the third driest in Australia since weather records started in 1900, but 2007 topped it. That year turned out to be the hottest year in history.
•After several lean years, the Millennium Drought caused devastating damages to Australian agriculture. The national wheat harvest dropped by 50 percent, and global grain markets panicked, since Australia was the biggest global exporter of wheat after the United States.
•In October 2006, wheat topped 5 USD for the first time. In summer 2007, the rally in wheat prices intensified. In February 2008, wheat prices broke the psychological barrier of 10 USD and closed the month at 12.80 USD. Prices had tripled since early 2006.
•The Millennium Drought in Australia was caused by El Niño, a weather phenomenon whose strength and frequency could be directly linked to global climate change, according to environmental and weather experts.
28 Natural Gas: Aftermath in Canada 2007
The new CEO of the Bank of Montreal, Bill Downe, must report a record loss for the second quarter of 2007 due to failed commodity price speculation. Half a year after Amaranth’s bankruptcy, another natural gas trading scandal shakes market participants’ confidence.
“How all of a sudden does a USD 450 million loss just materialize like this? Was it a lack of control from a risk perspective or was somebody hiding trades in a desk drawer?” —Leigh Parkinson, Risk Advisory
It was the middle of April when three of the directors of Optionable, a New York commodity broker, unloaded a share package worth nearly 30 million USD. Just days later, the auditor Deloitte and Touche released a report to its principal, the Bank of Montreal (BMO), stating that there was a 350 to 450 million CAD loss in its natural gas portfolio. This came as a nasty surprise for CEO Bill Downe, who had been in his position for only a month and who was about to announce BMO’s quarterly figures.
A Canadian Institution
Founded in 1817, the Bank of Montreal (BMO) is the fourth-largest bank in Canada in terms of deposits and has played a major role in the development of the country, having financed the construction of the first transcontinental railroad in the 1880s. Today BMO’s business activities are divided into private and commercial clients (retail banking), investment banking (BMO capital markets), and wealth management. Tony Comper served as CEO from 1990 to 2007, and during his leadership, in 2000, a small trading scandal occurred in futures trading of natural gas, causing damage of around 30 million CAD. Seven years later, Bill Downe took over.
The responsible trader at BMO was David Lee, who dealt in natural gas options both on the New York Mercantile Exchange (NYMEX) and over the counter. Lee had joined BMO in his mid-20s, coming from the Bank of New York, where he had been involved in building the commodity derivatives business from scratch. Beginning as an analyst, he soon switched to trading and specialized in natural gas options.
At BMO, Lee handled a large portion of his trades via Optionable. For a broker like Optionable with fewer than 20 employees, these trades represent almost 30 percent of his total revenue. It was no wonder that Lee and Kevin Cassidy, the CEO of Optionable, were close friends.
BMO’s commodity trading achieved a huge profit in 2006.
Trading in natural gas delivered an attractive additional income for BMO. Its commodity trading was 15 to 20 times larger than that of the Canadian market leader, the Royal Bank of Canada (RBC). BMO’s energy-trading business had grown to 25 traders. The bank had offices in Houston, New York, and Canadian energy metropolis Calgary, where in March 2006, at BMO’s annual general meeting, Tony Comper had announced excellent results in the investment banking segment, driven primarily by trading profits in oil and gas.
The commodity business was booming. Due to the damage caused by Hurricane Katrina in 2005, the price of natural gas was rising. In 2004 and the first half of 2005, the price hovered between 6 and 7 USD, but after the hurricane season, corporate clients increasingly were interested in price-hedging transactions. In December 2005, the price of US natural gas went over 15 USD/MMBtu.
This trend did not go on forever, though. Within weeks benchmark gas prices in New York had lost around two-thirds of their value. A mild winter ensured a sufficient supply of the commodity, which this time was unaffected by hurricanes. Customer interest cooled down significantly, but energy trading at BMO continued to grow.
The BMO team around David Lee was betting on a rebound in prices.
BMO’s star trader David Lee got it massively wrong with natural gas options.
Market participants could see that someone was building massive options positions on the NYMEX and over the counter, but prices continued to fall and volatility declined. The value of call options imploded.
The trading positions in Lee’s team were getting out of balance, but he was able to disguise his losses with the help of Optionable. Later the law firm Schatz Nobel Izard would accuse Optionable of having helped the BMO trader falsify his book and, among other things, of confirming incorrect trading prices. When Deloitte and Touche examined the upcoming quarterly figures, the loss could no longer be concealed. The auditors estimated the deficit came to 350 to 450 million CAD. BMO canceled collaboration with Optionable immediately, and Optionable stock lost almost 90 percent of its value.

At the end of April 2007, just days before the announcement of its quarterly figures, BMO announced a profit warning and pointed to the bank’s deferred trading positions in the commodity market, namely positions in natural gas, that would weigh heavily on quarterly profits. Companies such as Goldman Sachs and Citadel, a major Chicago hedge fund manager, showed interest in taking over the portfolio. However, BMO’s managers were convinced that they could handle the situation themselves. It turned out, though, that publicizing the trading positions before they could be reduced was the wrong strategy. The losses continued to increase.
When the quarterly figures came out in May, BMO had upped the losses on its commodity trading book to 680 million USD, the equivalent of about 12 percent of its total annual profit. Gritting his teeth, Downe reported the biggest trade loss of any Canadian bank in history, blaming market illiquidity and lower volatility. His rationale was not wrong, but market participants were skeptical, and analysts asked some unpleasant questions, about both the bank’s business strategy and the quality of its risk management. Bob Moore, executive managing director for commodity products, and David Lee had to leave the company. Lee was fined 500,000 USD and was banned from working in the banking industry. The total cost of the BMO trade scandal added up to around 850 million USD.
Key Takeaways
•Half a year after Amaranth Advisors’ bankruptcy, another natural gas trading scandal shook the commodity markets in 2007.
•David Lee was a celebrated star trader at BMO, and he and his team bet on a rebound of natural gas prices, after prices had declined from a record high of 15 USD due to damages from a record hurricane season.
•But prices declined further. Natural gas even traded temporarily below 4 USD again. For a while, Lee could disguise his loss of 350 to 450 million USD with the help of his broker Optionable. But auditors uncovered the problem.
•After earning record profits the year before, Lee’s energy trading imploded. Losses from the trading scandal added up to more than 800 million USD.
29 Platinum: All Lights Out in South Africa 2008
Due to ongoing supply bottlenecks of electricity from Africa’s largest energy provider, Eskom, South Africa’s major mining companies restrict their production, and the price of platinum explodes.
“South Africa needs at least 40 new coal mines to prevent shortages over the long term.” —Brian Dames, Eskom
“Restoring energy security for the country is an absolute imperative.” —Cyril Ramaphosa, president of South Africa in 2019
Two years before the World Cup kickoff in June 2010 in South Africa, the country faced its worst electricity supply bottleneck in decades. In spring 2008 the government declared an energy emergency. The national utility company Eskom—the largest electricity provider in Africa—shut down power for several hours every day for weeks, since its capacity lagged far below demand. For 20 years the country’s economy had been growing at a rapid pace. Electricity demand had risen 50 percent since the end of apartheid in 1994, but the South African government and Eskom had failed to provide additional capacity. The electricity company had repeatedly stressed that the nation’s power plants would have to be overhauled and new power plants built, but government agencies ignored these warnings.
Because there was not enough power available, electricity was rationed at various intervals and in different zones, resulting in two- to three-hour power outages every day. Particularly affected were Johannesburg and the Gauteng region, the center of gold and platinum production. Around half of the mining companies’ energy demand was needed just to maintain infrastructure. Without electricity, the water could no longer be pumped out of the mines, and getting sufficient oxygen several kilometers deep became critical. The impact on actual production was even more dramatic. The Miners’ Union said that the companies sent tens of thousands of workers home or for training. At the end of January, the situation worsened. The energy company operated the world’s largest coal-fired power plant, the Kendal power plant, and Eskom’s coal reserves were being soaked by rainfall. At this point international precious metal prices began to react.
Eskom turned off the power for the mining companies.
Precious Platinum and Palladium
The group of platinum metals (PGMs) includes platinum, palladium, rhodium, iridium, osmium, and ruthenium, but the economically important metals in this group are platinum and palladium, whose trading is overseen by the London Platinum and Palladium Market (LPPM). South Africa and Russia together account for around 90 percent of the world’s platinum metals production. Smaller producer countries are Canada, the United States, and Zimbabwe. The major companies are Anglo American Platinum (Amplats), Impala Platinum (Implats), Lonmin in South Africa, and Norilsk Nickel in Russia. In recent years, Sibanye has also grown into a new player through takeovers and acquisitions.
Platinum is mainly used for catalysts (50 percent) and jewelry (25 percent); while for palladium, in addition to those applications, dentistry and electronics are important. Price-determining factors for both metals are Russian and South African production, Russian inventories, and global growth rates.
South Africa had been the center of global gold production since the end of the 19th century, though it had fallen back over the past 30 years to eighth place. However, South Africa still has a dominant position in producing platinum. Around 80 percent of the world’s production comes from that country, with the overwhelming majority being produced in the Bushveld complex. The prices for platinum are correspondingly sensitive to any negative news from South Africa.
Prices for platinum had been rising steadily since mid-2005, but the momentum increased significantly in late 2007 and early 2008. For the first time in seven years, the multinational firm Johnson Matthey, the world market leader in auto catalysts and thus the largest customer of platinum, expected falling shipments for the entire year.

At the end of January 2008, the news that the three largest gold producers in South Africa and the largest platinum producer were reducing production in all mines caused prices to jump. Amplats, with a 40 percent market share, expected production losses of 9,000 ounces per day. The number-two firm, Impala Platinum, claimed to lose about 3,500 ounces per day. Overall, South Africa’s platinum miners feared a 2008 production loss of 0.5 million ounces.
By March 2008 the price of platinum rose to more than 2,200 USD/oz.
In addition to gold, the price of platinum in particular rose overnight by almost 100 USD to more than 1,700 USD. At the beginning of March 2008, the price of a troy ounce of platinum closed at more than 2,250 USD, a temporary price maximum.
Electricity supplier Eskom slowly began to regain control of the situation, but industry production was still running at only 90 percent capacity, and the company predicted that supply problems would continue until at least 2020.
And the years of mismanagement and corruption continued. In February 2019 the situation escalated again, as Cyril Ramaphosa, the president of South Africa following Jacob Zuma, declared Eskom to be “too big and too important to fail” during the Indaba mining conference in Cape Town. Besides its aging coal-fired plants, the company suffers from a debt level of more than 30 billion USD. A breakup, a government rescue plan, as well as a 15% increase in its tariffs to its industrial customers are in the cards for 2019. At the same time, an ounce of platinum costs 800 USD—a new price rally is about to unfold!
Key Takeaways
•In 2008, South Africa faced its worst electricity supply bottleneck in decades, and the government declared an energy emergency. Eskom, the national utility company and the largest electricity provider in Africa, shut down power for several hours every day.
•Although South Africa’s golden days of gold mining were over, it remained the dominant force in platinum group metals, with about 80 percent of the world’s production.
•At the end of January 2008, the three largest gold producers and the largest platinum producers all reduced their mine production as a result of continuing power outages.
•That development spurred prices for platinum, which had been rising steadily since mid-2005 and had already reached 1,000 USD. By March 2008, the price of platinum climbed above 2,200 USD per troy ounce, its highest price ever!
30 Rice: The Oracle 2008
The Thai “Rice Oracle,” Vichai Sriprasert, predicts in 2007 that rice will increase in price from 300 USD to 1,000 USD, and he becomes a figure of ridicule and mockery. However, a dangerous chain reaction affecting the rice harvest is about to start in Asia and, with Cyclone Nargis, culminates in a catastrophe.
“National hoarding really doesn’t help the market.” —Robert Zeigler,
International Rice Research Institute
At 65, Vichai Sriprasert was one of Thailand’s largest rice exporters, nicknamed the “Rice Oracle.” Years of experience with the interrelationship between supply, demand, and price development had earned Vichai a lot of money as well as the honorary chairmanship of the Thai Association of Rice Traders. As the world’s largest exporter of rice, Thailand was a determining factor in international trade.
Disbelief and ridicule were the initial reactions to Vichai’s prediction, in 2007, that rice prices were likely to exceed 1,000 USD per ton in the following year. At the time Thai export rice was priced at around 300 USD per ton. After a rapid increase in the price of oil and dramatically higher prices for wheat and corn, however, the laughter disappeared. In spring 2008, the price of rice actually broke Vichai’s targeted 1,000 USD mark. And it would continue to rise. For Vichai, the situation was comparable to the 1970s, when in the shadow of the oil crisis, rice prices rose to around 2,700 USD per metric ton.
Rice Realities
According to figures from the Food and Agriculture Organization (FAO), rice—along with corn and wheat—is one of the most widely cultivated cereals in the world, with an annual production of around 650 million metric tons. The largest producer countries are China, India, Indonesia, Bangladesh, Vietnam, and Thailand. Due to its predominantly wet cultivation, between 3,000 and 5,000 liters of flowing water are needed per kilogram of rice. On the one hand, this has a positive effect in terms of lower pest and weed infestation; on the other hand, this can lead to serious crop failures in periods of dry weather.
Despite the importance of rice, futures trading is insignificant, with less liquidity than the wheat or corn market. The most important trading place for rice is the Chicago Board of Trade (CBOT) in the United States. Traded contracts are quoted in US cents per American centner or hundredweight (1 cwt equals 100 lb equals 45.359 kg), with one contract covering 2,000 hundredweights.
What had happened? Driven by the rising price of crude oil, the prices of many agricultural goods rose sharply in 2007, a condition called “agflation.” The food price index, calculated by the FAO, had risen by 57 percent within just one year, from March 2007 to March 2008. Wheat and soybean prices also doubled, and the price of corn had increased by 66 percent since autumn 2007.
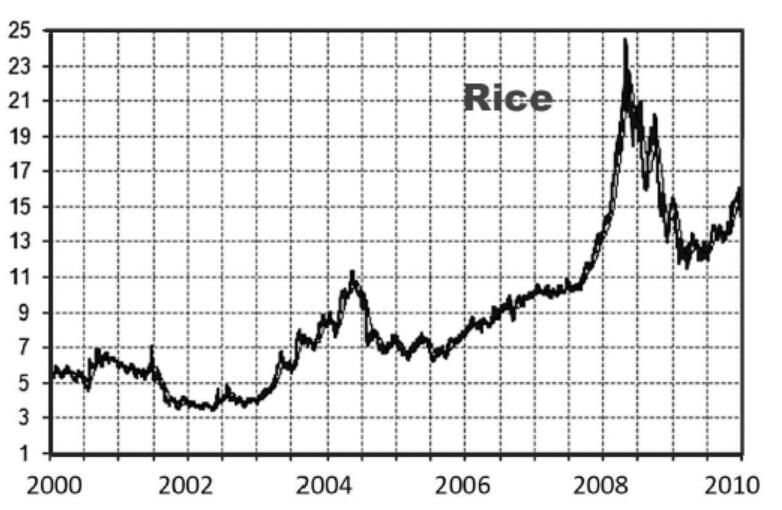
However, the price of rice was still well above that of other agricultural goods and was developing its own momentum in spring 2008. From June 2007 to April 2008, rice prices rose by around 75 percent—even more in Asia. Prices increased from 400 USD per metric ton to more than 1,000 USD.
The price spike had widespread consequences. Rice is a staple food for around three billion people, and in many countries nearly half of household income is spent on nutrition. The rise in prices threatened political stability in several countries and caused serious unrest around the world. In Haiti several people were killed in protests, and uprisings were reported in Egypt, Burkina Faso, Cameroon, Indonesia, Côte d’Ivoire, Mauritania, Mozambique, and Senegal. How did all this happen?
The globally traded rice volume of 30 million tons was very low compared to the total production of 650 million tons.
The rice market is generally subject to structural deficits. The average amount of rice traded on the world markets per year—around 30 million metric tons—is very low compared to global production of around 650 million tons. This makes global prices extremely vulnerable to short-term fluctuations in supply and demand. Urbanization, demographics, and the demand for alternative energies and weather conditions all are influential factors and also apply to other agricultural goods to some extent.
For example, rapid urbanization in Asia has destroyed more and more agricultural acreage, and increasing prosperity on that continent has also led to more meat consumption, increasing the amount of grain needed to feed livestock. The consumption of meat in China alone increased by about 150 percent in the past 30 years. Furthermore, the rice fields of Asia have had to absorb an annual birth rate of about 80 million babies in the region. Indirectly, the high price of oil and a related increase in demand for biofuels are also driving up the price of rice, as many farmers switch to the more profitable cultivation of corn, wheat, and oilseeds.
Some countries recorded significant losses in their rice harvest due to weather in 2007–2008. Thunderstorms and floods destroyed more than 20 million hectares of fields within one year, twice the total acreage of Thailand. Bangladesh, generally a major exporter of rice, suffered significant crop losses in 2007 from floods and Tropical Storm Sidr, which destroyed almost the entire crop. The rice harvest in Vietnam was also hampered by severe pest infestation and disease. As a result, the price of rice continued to rise, and the situation gradually worsened.
With panic buying and export restrictions, the dominoes were falling: In Asia, supplies continued to be stretched. The rice-exporting countries of Vietnam and India issued restrictions on the export of rice, while India slowed exports to stabilize prices at home. Other exporting countries, such as China, Egypt, and Cambodia, joined in with quotas and taxes. China was so worried about supplying its own population that it waived exports until further notice, while in Thailand, farmers, traders, and rice mills began to hoard their rice.
In Asia, hoarding and export restrictions worsened the already tight supply.
Everywhere in the region there was panic buying. Even in the United States, Wal-Mart rationed its sales to customers. The world’s largest importer, the Philippines, announced massive purchases to forestall further supply shortages. Importing countries like Bangladesh, Indonesia, and Iran were also affected. And then, on the night of May 3, a catastrophe occurred.
Cyclone Nargis hit the coast of Myanmar, devastating the rice supply region in the middle of the harvest season and leaving between 50,000 and 100,000 people dead. The price of rice shot up again, and the risk of famine and revolts caused by hunger rose. As the price of rice quadrupled, many regions were threatened by unrest. In addition to the tight supply and the unfavorable weather, export restrictions and hoarding had created an artificial shortage, dramatically exacerbating the situation. Even Vichai did not foresee how bad the situation would become.
In May 2008, however, the supply situation eased. Pakistan, one of the largest rice producers, loosened its export restrictions, and the crop in India was more than 2 million metric tons larger than expected. However, the structural problems of the rice market would remain. Given a comparatively small international market, repeated supply bottlenecks in Asia are to be expected in the future.
Key Takeaways
•In the beginning of 2007, Vichai Sriprasert, the “Rice Oracle” of Thailand, predicted a massive increase in the price of rice, a ridiculous thought at that time.
•Later in 2007, however, prices of many agricultural goods rose sharply, driven by increasing crude oil prices (“agflation”). The situation in the rice market was especially critical.
•From June 2007 to April 2008, rice prices in Asia increased from 400 USD to more than 1,000. Hoarding and export restrictions worsened an already tight supply.
•When Cyclone Nargis hit Myanmar in May 2008, it devastated that country’s rice harvest and left as many as 100,000 people dead.
•The price of rice quadrupled, and many regions were threatened by unrest, causing difficulties that even the Rice Oracle did not foresee.
发表回复