31 Wheat: Working in Memphis 2008
The price of wheat speeds from record to record. Trader Evan Dooley bets on the wrong direction, juggling 1 billion USD and dropping the ball. This results in a loss of 140 million USD for his employer, MF Global, in February 2008.
“I simply do not know where the money is.” —Jon Corzine, CEO of MF Global
Less than a month after Jérôme Kerviel’s catastrophic bet on European equity indices, which resulted in losses of nearly 5 billion USD to French investment bank Société Générale, another trader caused difficulties for his employer.
This time it was through speculation on wheat futures. At the end of February 2008, MF Global, one of the world’s largest futures and options brokers, had to admit that one of its traders in Memphis, Tennessee, had speculated on wheat futures with corporate accounts. Within hours, a loss of about 140 million USD occurred.
Spun out of Man Financial Group in 2007, MF Global was a commodity brokerage house that offered clearing and execution services. It had ambitions to become a financial services firm on the order of a Goldman Sachs or JPMorgan, and its CEO was Jon Corzine, former chairman of Goldman Sachs and onetime governor of New Jersey. Although it was a niche player on Wall Street, MF Global was a force on the Chicago Mercantile Exchange (CME), with 3 million futures and options positions open with a face value of more than 100 billion USD. Its customers made up almost 30 percent of the trading volume on the CME.
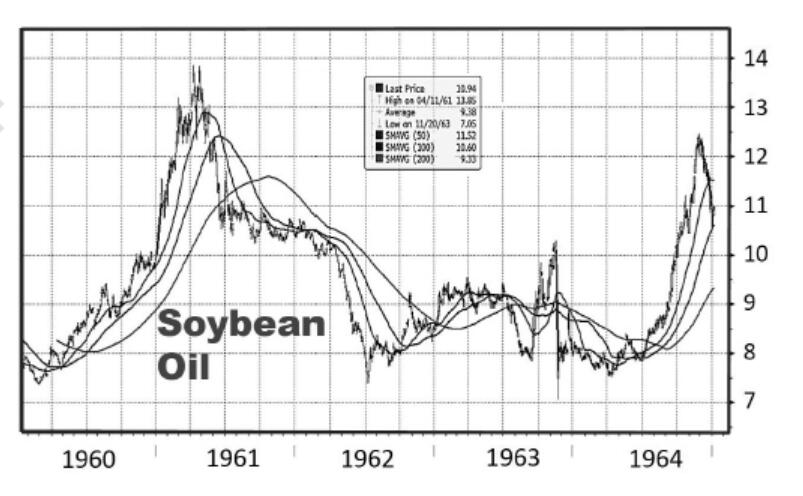
Trading Wheat
After corn, wheat is the second-biggest agricultural crop in the world, and it is traded worldwide on commodity futures exchanges. On the Chicago Board of Trade (CBOT), wheat is traded under the symbol W and the current contract month (e.g., W Z0 for wheat December 2020). One contract refers to 5,000 bushels of wheat, and each bushel is equivalent to 27.2 kilograms.
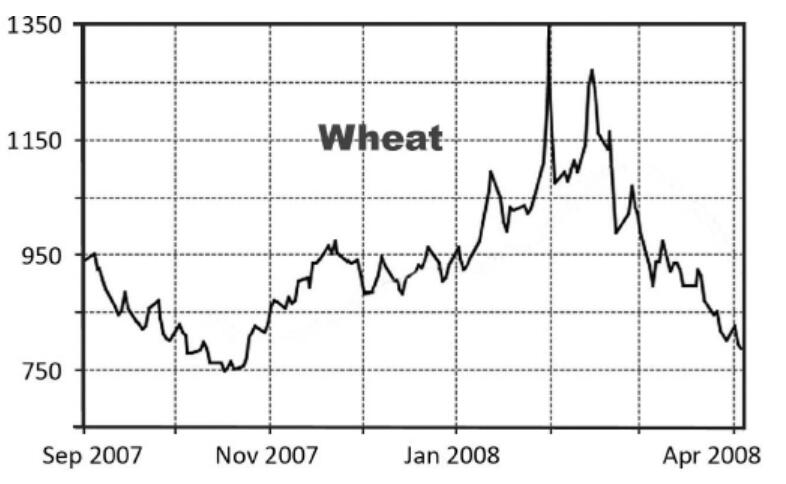
Priced at 7.50 USD per bushel in November 2007, US wheat was already trading above 8 USD by the beginning of 2008. In part this was due to a tightening supply, but the increase was also increasingly driven by speculative capital, along with a weak US currency. The price broke through 9 and 10 USD per bushel within days, and at the end of February the situation had really gotten out of hand. On February 27, wheat contracts close to delivery experienced price movements of as much as 25 percent within a day. Although trading opened positive, by noon the price had fallen to 10.80 USD.
Trader Evan Dooley speculated on falling
prices of 2 million tons of wheat.
In the afternoon, however, the price jumped again, to 13.50 USD per bushel. The news that Kazakhstan, one of the largest exporters of wheat, wanted to introduce export taxes to reduce sales was boosting the US wheat price. It was the strongest intraday price movement in wheat ever observed.
However, there was also another explanation for the price swings: Evan Dooley, who had been a trader at MF Global since November 2005, had quickly entered significant positions in wheat futures on his own account in the morning hours of February 27. With these unauthorized actions, the 40-year-old trader exceeded his limits by far.
Betting on a falling wheat price, Dooley is said to have traded around 15,000 futures—2 million metric tons of wheat. The value of the position varied between 800 million and 1 billion USD. However, as the wheat price continued to rise sharply, the company was forced to close the position with losses, that is, to buy further futures contracts. This led to a further price jump to a level that the market would not reach again, despite continuing strength, for several years.
MF Global shares lost more than 25 percent in value on that day. The losses came to approximately 140 million USD and represented four times the previous quarter. Concerned about the extent of the loss, MF Global promised to revise its internal policies and risk management. Dooley was fired immediately, and MF Global was fined 10 million USD for lack of supervision of its traders. Dooley himself was sentenced to five years in federal prison and had to make restitution of 140 million USD.
On a side note, MF Global collapsed in 2011 when the company reported a 192 million USD quarterly loss. Client funds disappeared in the aftermath, which became a huge scandal. However, the failure of MF Global, with more than 40 billion USD in assets—the eighth-biggest bankruptcy in US history—was modest compared with the chaotic 2008 failure of Lehman Brothers, which had a 691 billion USD balance sheet. Regulators were eager to show that not all Wall Street firms were too big to fail. They happily let MF Global go under.
Key Takeaways
•Less than a month after Jérôme Kerviel’s catastrophic bet on European equity indices in 2008, another trader caused trouble for his employer: Evan Dooley of MF Global speculated on falling wheat prices and built up a short position of almost 1 billion USD.
•Wheat prices kept climbing higher and higher, however, from 7.50 USD per bushel in late 2007 to more than 10 USD per bushel in January 2008.
•On February 27, 2008, the price of wheat traded in Chicago fluctuated in the course of the day by 25 percent—falling back to 10.80 USD per bushel, then jumping again to 13.50 USD in the afternoon. MF Global accumulated a loss of about 140 million USD within hours.
32 Crude Oil: Contango in Texas 2009
The price of West Texas Intermediate (WTI) crude oil collapses, unsettling commodity traders around the world. A 10,000-person community in Oklahoma becomes the center of world attention. The concept of “super-contango” is born, and investment banks enter the tanker business.
“Super-Contango is a state in which a forward price of a commodity is higher than the spot price to a greater extent than can be explained by the interest and storage costs that explain the usual state of contango.” —Moneyterms.co.uk
Cushing is a small town in Oklahoma with fewer than 10,000 residents: There’s a Wal-Mart, some fast-food restaurants, and a few gas stations. Only massive tanks, pipes, and refineries hint that the town is somehow special. In the south of the city is a complex for the strategic oil reserves of the United States, with a capacity of 35 million barrels—one of the largest in the country.
Suddenly, at the beginning of 2009, Cushing—the only delivery location for West Texas Intermediate (WTI), the US benchmark for crude oil—became the focus of the world’s attention. In the oil market, big-time inventory building had begun. And it began on a large scale.
Trading in Crude
Because of the many different types and qualities of crude oil, market participants have agreed to trade in a few local varieties for reference: At the New York Mercantile Exchange (NYMEX), this is US West Texas Intermediate (WTI) oil, at the Intercontinental Exchange (ICE) in London it’s North Sea Brent, and in Singapore the Asian reference is Tapis. Additionally, there is an OPEC basket price, which calculates the average price of seven different types of crude: Sahara Blend (Algeria), Minas (Indonesia), Bonny Light (Nigeria), Arab Light (Saudi Arabia), Dubai (United Arab Emirates), Tia Juana Light (Venezuela), and Isthmus (Mexico). On commodity futures markets, WTI and Brent are the primary references for the price of oil, which is traded in 1,000 barrels per contract under the abbreviations CL (WTI) and CO (Brent) as well as the corresponding contract months (e.g., Z9 for December 2019).
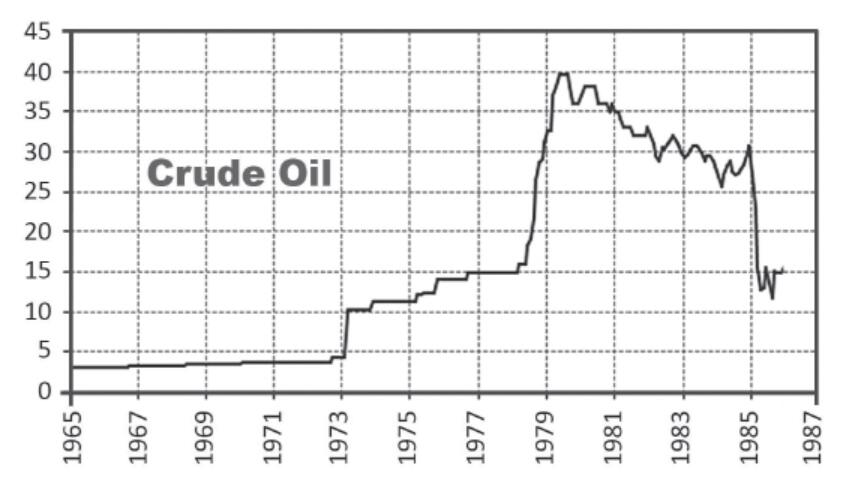
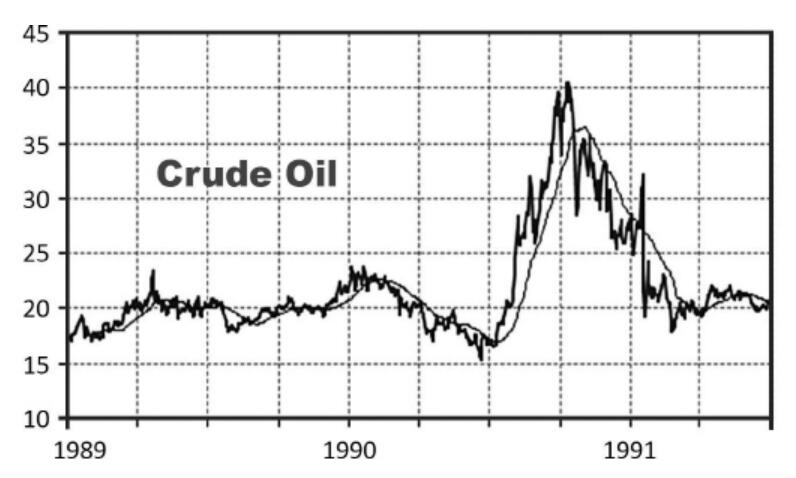
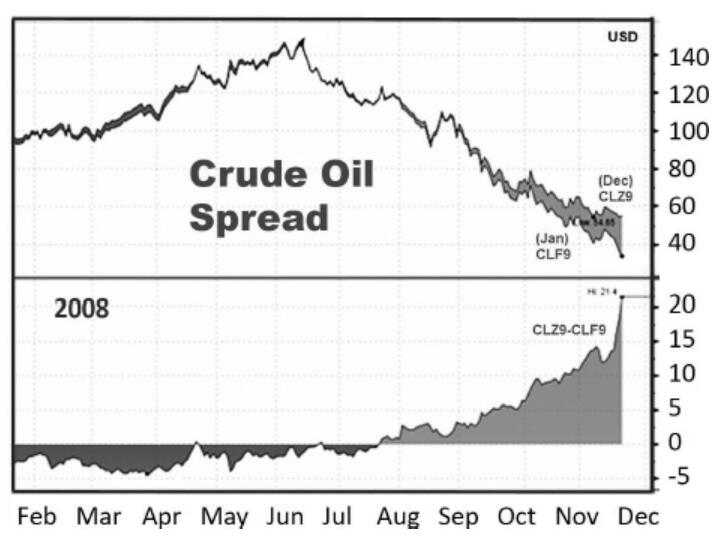
In the wake of the financial market crisis and the deteriorating economic outlook, the price of crude oil had come under massive pressure in the second half of 2008. That summer, crude oil had briefly traded at more than 145 USD for a short time. But then, the price dropped to less than 45 USD. The withdrawal of investment capital (“deleveraging”) also contributed significantly to the price decline. This became obvious through an analysis of the short-term crude oil contracts in which financial investors are typically invested, and which were now much more affected than long-term contracts.
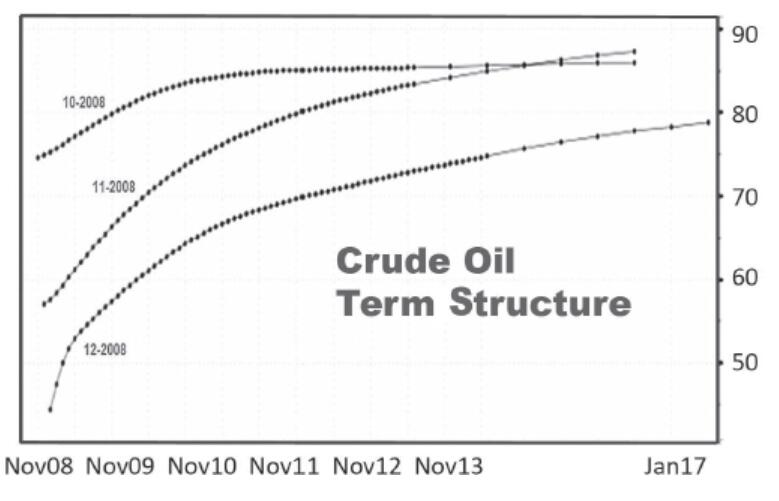
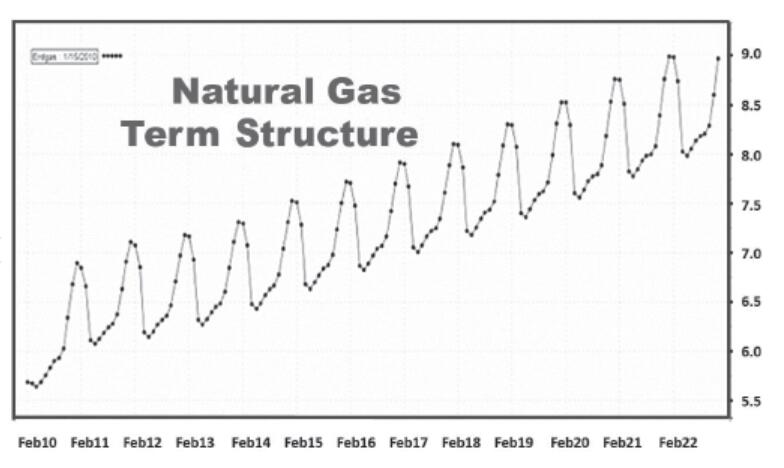
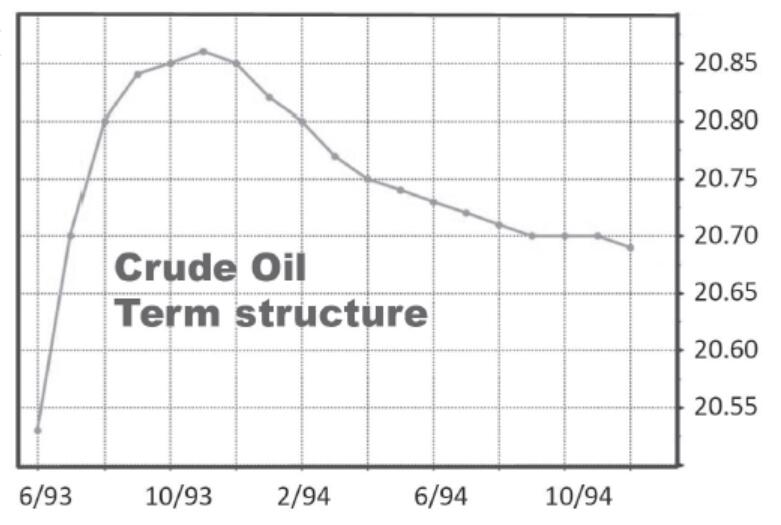
The forward term structure, which tracks the price of future crude oil deliveries over a period of several years, was still nearly flat in summer 2008, but from there, the contango structure of crude oil (WTI) increased. Contango refers to the situation in which spot prices are below the level of futures prices. This could be due to warehousing costs, including insurance and interest, for example, although those can be superseded by the effects of supply and demand.
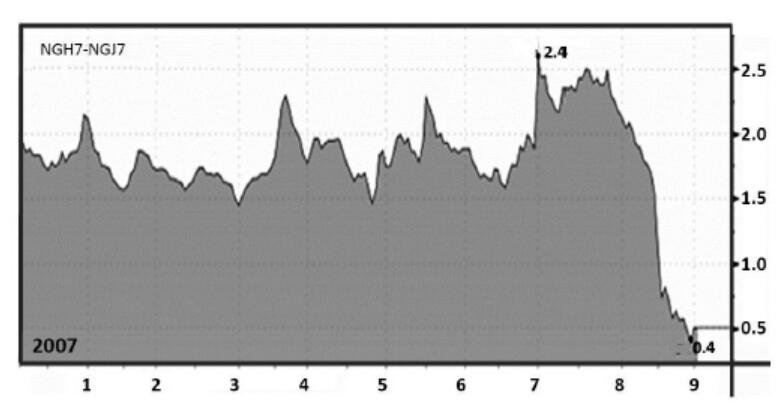
Between October and December 2008, the contango became extreme. The price decline at the short end of WTI contracts led to a record price difference (the spread)—in excess of 20 USD—between contracts for WTI January 2009 and WTI December 2009. Commodity traders introduced the term “super-contango” to describe what was happening, and commodity analysts called the price distortion of crude oil “absurd.” WTI decoupled completely from other crude oil reference prices such as Brent and, as a barometer for international crude oil markets, was “as useful as a chocolate oven glove,” noted a commodity analyst of Barclays, the British investment bank. What led to this situation? And, more importantly, what were the implications?
Super-contango! Front-end WTI traded as low as 35 USD, while later crude contracts with later dates stayed above 50 USD.
The world’s attention turned to Cushing, the world’s “pipeline crossroads” and the only source of WTI crude oil. Contango favors stockpiling, because instead of a low current price, oil can be sold for more at a later date. The only obstacle is that the owner of the crude needs to have appropriate storage facilities. At Cushing, due to the increasing contango, the storage level of oil was steadily increasing.
In January, oil inventories counted more than 33 million barrels (1 barrel equals 159 liters), and the remaining capacity literally was disappearing like ice in sunshine. The super-contango led to “super-storage,” because every holder of crude oil futures without the appropriate capacity had to sell crude oil, if needed, regardless of price. At its low, US crude oil was trading below 35 USD.
It’s hard to know whether the super-contango was merely an expression of the short-term oversupply of the crude oil market due to the economic slowdown, or whether this was the effect of disinvestment of index and hedge fund capital in the forward contracts. In any case, the steepness of the crude oil forward curve continued to increase.
An additional factor, apart from the price differences, distinguished this situation from past events: The economic slowdown and the effects of the credit crunch had put international freight rates under extreme pressure. At the beginning of 2009, freight rates for oil tankers were around 85 percent below their highs in summer 2008.
The crude oil super-contango, combined with low freight rates, provided a lucrative business for investment banks.
For a short while early in 2009, the price difference between a current crude oil contract and a December 2009 contract exceeded 30 percent. The combination of super-contango and the low crude oil tanker freight rates opened up a new field not only for crude oil traders but also for investment banks, since it was possible to store crude oil in oil tankers on the high seas.
With sufficient inventories, it made no sense to sell oil at prices below 40 USD, if you could sell above 55 USD risk-free through a futures contract. January crude oil prices were trading 20 USD below December contracts, while the cost of storage aboard on a supertanker in January 2009 averaged around 90 US cents a barrel. Assuming that transportation, insurance, and financing were secured, there was an opportunity for immense profit for oil companies and traders.
Tanker Talk
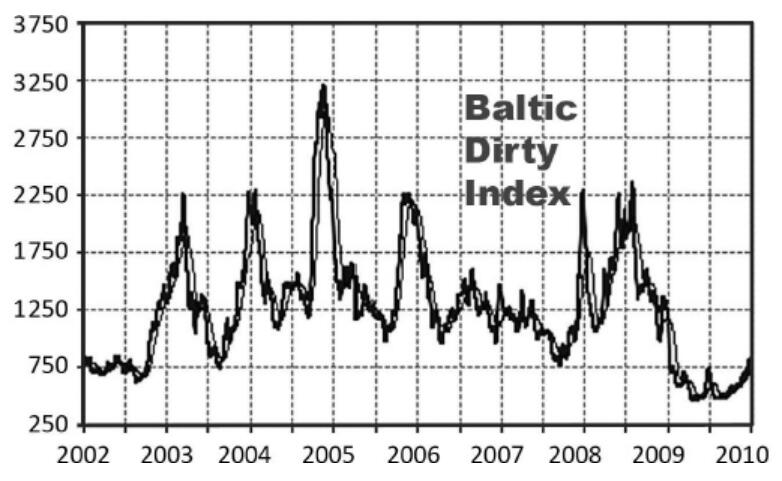
The Baltic Exchange is a global marketplace for shipbrokers, shipowners, and charterers. The various indices of the stock exchange offer an important overview of freight rates differentiated according to cargo types, ship sizes, and shipping routes. The Baltic Clean Tanker Index tracks tankers carrying clean cargo, such as oil products (petrol, diesel, fuel oil, or kerosene); the Baltic Dirty Tanker Index is for tankers that carry cargo such as crude oil. In 2009, freight rates for bulk carriers—summarized in the Baltic Dry Index—had fallen by 94 percent since the previous summer, due to the economic slowdown and the credit crunch during the international financial crisis. In comparison, the freight rates for tankers lost a little less. Freight rates for crude oil fell by around 85 percent.
Tanker lease periods between three and nine months were particularly sought after.
In February 2009, Frontline, the world’s largest owner of supertankers, reported that 25 tankers had been chartered, and there were still open inquiries about 10 more ships. Any tanker that held less than 2 million barrels of oil was not statistically recorded, but industry experts estimated that there were as many as 80 million barrels on the water at the time, more than twice as much oil as was in official storage in Cushing. The profitable business had also taken on a new dimension. The new customers were no longer BP or Exxon, but Merrill Lynch, Morgan Stanley, Goldman Sachs, Citibank, Barclays, and Deutsche Bank.
Ship brokers around the globe were surprised by the extent of storage inquiries. After all, 35 supertankers accounted for roughly 10 percent of crude oil tanker capacity worldwide. Due to additional demand, tanker freight rates recovered slightly from their lows. However, the floating inventories prevented a significant spike in oil prices during the year, despite any improvement in underlying economic data. After a nearly 75 percent drop in crude oil prices in just one year, the supply surplus of floating stock unsettled the market. For 2008, the International Energy Agency (IEA) reported a decline in oil demand for the first time since 1983.
Key Takeaways
•Cushing, a small town in Oklahoma, is the pipeline capital of the world—the only delivery point for WTI, the most important benchmark for crude oil.
•In the summer of 2008, crude oil was trading above 145 USD. But then the price collapsed to less than 45 USD, and WTI switched from backwardation into a deep contango. A super-contango was born.
•In combination with low freight rates due to the economic crisis, the oil super-contango provided a lucrative business for investment banks, which could physically buy oil, store it in supertankers, and sell it on futures exchanges, locking in a secure profit.
•The super-contango led to a massive supply glut in crude oil for a number of years.
33 Sugar: Waiting for the Monsoon 2010
A severe drought threatens India’s sugar harvest, and the world’s largest consumer becomes a net importer on the world market. Brazil, the largest exporter of sugar, has its own problems. As a result, international sugar prices rise to a 28-year high.
“The peacocks are not dancing.
It will not rain.”
—P. K. Dubey in Monsoon Wedding (2001)
June 2009 was the driest summer month in India for more than 80 years, and the dry season was nowhere near ending. In the first week of August, rainfall was only one-third of its normal level. In the main agricultural areas in the north of the country, the weather phenomenon called El Niño had practically stopped the monsoon, whose season on the subcontinent usually lasts from the beginning of June to the end of September.
One consequence of El Niño in India is significant crop failures, but India’s frequent experience of drought and famine has historically led to large storage facilities. According to the US Department of Agriculture, about 20 million metric tons of rice and about 30 million tons of wheat were stored in 2009. For sugar, however, the situation was quite different.
Crop failures were so severe, especially in the state of Uttar Pradesh, that India—the second-largest sugar producer in the world—changed from being a net exporter of the crop to becoming a net importer. After producing more than 26 million metric tons of sugar the year before, the country was initially expected to consume 22 million tons of sugar in 2009. However, in August, the Indian Ministry of Agriculture revised the harvest estimates downward, first to 17 million tons and later to 15 million tons. It was not until 2011 that the Indian authorities expected a harvest of around 25 million metric tons of sugar.
Sweet!
Almost three-quarters of the sugar produced in more than 100 countries comes from sugarcane, grown primarily in tropical and subtropical regions. Sugar beets come mainly from the European Union and Russia. Brazil, the largest sugar producer and exporter, is responsible for about 16 percent of the world’s sugar, followed by India (14 percent), China (6 percent), and the United States (5 percent). In Brazil, more than half of the sugar harvest is processed into fuel (ethanol).
Sugar is traded on multiple futures exchanges in different classifications. The most liquid trading is in Sugar No. 11 (ticker SB) on the New York Board of Trade (NYBOT), where futures contracts are traded in US cents per pound and comprise approximately 50 metric tons of sugar (112,000 pounds). Together with wheat, corn, and soybeans, sugar is the most liquid traded agricultural commodity.
In 2008, the global trading volume of sugar was about 45 million tons, which equates to almost one-third of the quantity produced worldwide. Two-thirds of total sugar production is consumed directly in producer countries and is excluded from global trade. If other trade barriers, such as quotas and trade agreements, are taken into account, only about 25 percent of the world’s sugar is available to the global market, and about 40 percent of that comes from Brazil, which has quadrupled its sugar production since the early 1990s.
With severe weather in India and Brazil, the price of sugar shot up.
Like India, Brazil also had to cope with severe weather conditions in 2009. The problem there was not drought, however, but too much water.

Over the past 40 years, the price of sugar has been very volatile. Starting with prices as low as 1 US cent per pound in 1967, the price exploded in the mid-1970s to more than 60 US cents. Then, in 2004, the price of sugar slipped below 6 US cents—levels that had not been seen for more than 20 years.
In 2010, however, there was a sugar rush! Massive imports from India and weather-related delivery delays in Brazil pushed the raw sugar price to a 28-year high. Futures contracts closed at 29.90 US cents per pound on January 29, 2010, a premium of more than 150 percent compared to the previous year. The situation calmed down only after the March contracts expired on February 26, 2010. At that point positive data from Brazil signaled that the worst scarcity was over.
Key Takeaways
•The three most important sugar producers worldwide are Brazil, India, and China, and the latter two mostly produce the crop for their own use.
•The summer of 2009 was the driest summer in India for more than 80 years. El Niño caused significant crop failures, India became a net importer of sugar on the world market, and Brazil had weather-related problems as well. The price of sugar spiked around the globe.
•Sugar prices rose to just under 30 US cents per pound by the end of January 2010—more than 150 percent over the previous year. Compared to prices in 2004, when sugar traded below 6 US cents, it represented a staggering increase of 500 percent and the highest price in almost 30 years.
34 Chocolate Finger 2010
Due to declining harvests in Côte d’Ivoire (the Ivory Coast)—the largest cocoa exporter on the world market—prices are rising on the international commodity futures markets. In the summer of 2010, cocoa trader Anthony Ward, “Chocolate Finger,” wagers more than 1 billion USD on cocoa futures.
“Of course they are people. They’re Oompa Loompas.“ —Willy Wonka in the movie Charlie and the Chocolate Factory
Cocoa, native to Central and South America, was considered by the Maya and the Aztecs to be a gift from the gods and therefore sacred. The seeds of the cacao tree also served as a means of payment. In the treasuries of Aztec king Moctezuma II, the Spanish conquistadors discovered, in addition to gold, more than 1,200 tons of cocoa—tax revenues and a huge currency reserve.
Today cocoa is an important cash crop, an export commodity for many developing countries, and the raw material for the production of chocolate. (In Germany, one of the countries with the highest per capita consumption of chocolate worldwide, every person eats an average of around 9 kilos per year.) Production costs for chocolate depend on the cocoa content, cocoa quality, and processing time, so that for a normal chocolate bar, the price of cocoa accounts only for about 10 percent of the cost of production.
Cocoa is traded in New York on the New York Board of Trade (NYBOT) and in London on the London International Financial Futures Exchange (LIFFE) in contracts of 10 tons each in USD and GBP, respectively.
The 10 largest cocoa producers account for more than 90 percent of the world’s crop. Côte d’Ivoire dominates global production with a market share of more than a third of world production.
In July 2010, market rumors in London suggested that the Armajaro hedge fund had placed a 1 billion USD bet in the cocoa market. Fund manager Anthony Ward was said to have bought around 240,000 tons of cocoa in an attempt to corner the market. This would have accounted for about 7 percent of global cocoa production and the majority of the available quantities. While some traders saw this as a bet that cocoa prices would continue to rise due to a declining supply, others argued that Ward was creating an artificial shortage and manipulating the market through his massive purchases just before the start of the annual cocoa harvest in October.
Where’s the Cocoa?
Cocoa’s main growing areas have shifted in recent years from Central America to Africa. The 10 largest producer countries account for more than 90 percent of the global cocoa harvest. Of these, Côte d’Ivoire is the largest supplier of cocoa in the world, with a market share of more than 33 percent. Indonesia, Ghana, Nigeria, Brazil, and Cameroon follow far behind. By 2010, however, cocoa production in Côte d’Ivoire had fallen by more than 15 percent over the previous five years, largely due to poor crop maintenance and pest infestation. Cocoa production in 2008–2009 was the smallest harvest in the previous five years, at just 1.2 million metric tons, a trend that market participants expected for the 2009–2010 crop as well.
At age 50, Anthony Ward was considered a genius in trading cocoa. His attempt to corner the market for cocoa was spectacular but not an isolated event. In 2002, Ward had purchased more than 200,000 tons of cocoa—the equivalent of 5 percent of the world’s cocoa market—through futures contracts. That was not the biggest cocoa transaction, however. The cocoa trading desk at Phibro, Salomon Smith Barney’s commodity trading business, had taken a position of 300,000 tons of cocoa in 1997. The head of the cocoa trading desk at that time? Anthony Ward.
Anthony Ward had been a cocoa trader and industry expert since 1979. In the first months of 2010, the price rose more than 20 percent because of his trades.
Anthony Ward gained his first trading experiences in 1979 with tea, rice, cocoa, and rubber. In 1998 he co-founded Armajaro with Richard Gower, initially focusing on cocoa, then adding coffee and, later, other agricultural goods. Today Armajaro manages 1.5 billion USD and, with a local presence in Côte d’Ivoire, Indonesia, and Ecuador, is one of the largest cocoa suppliers to the world market. After Ward’s trades in July 2010, the British press dubbed Ward “Willy Wonka,” after the character in Charlie and the Chocolate Factory, and “Chocolate Finger,” in homage to a James Bond villain.
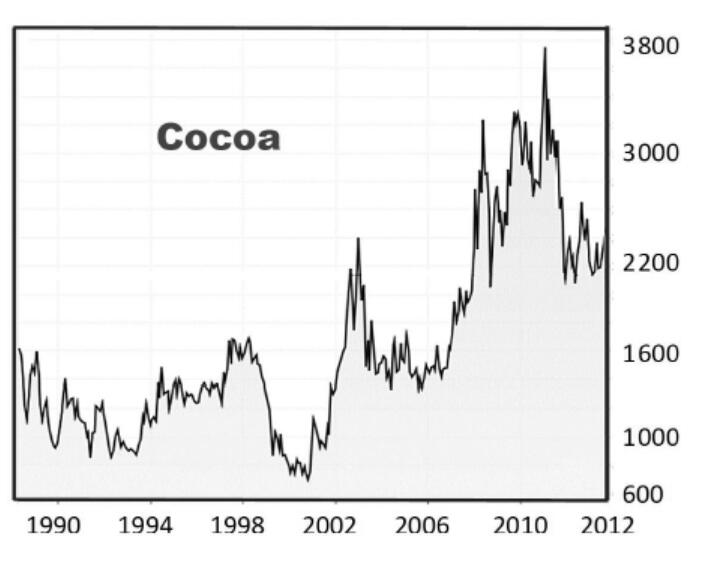
In 2009 and 2010, increasing demand, declines in production, and price speculation by hedge funds caused cocoa prices to rise more than 150 percent within two and a half years and to reach their highest level since 1977. A ton of cocoa in mid-July cost more than 3,600 USD. Because of Armajaro’s purchases, the short-term price of cocoa rose: A July contract carried a 300 USD premium compared to a December 2010 contract. Customers had to pay a premium of around 15 percent compared to a later delivery (backwardation).
In a letter to the NYSE and LIFFE, 16 companies and trading houses complained about market manipulation of the cocoa market. However, LIFFE declared that “indications for a market manipulation are not recognized.”
Key Takeaways
•The cocoa market is relatively small and highly concentrated: Côte d’Ivoire dominates global cocoa production with a market share of more than a third of world production. The 10 largest cocoa-producing countries account for more than 90 percent of the world’s crop.
•During the summer of 2010, rumors spread that hedge fund Armajaro had placed a bet of 1 billion USD in the cocoa market. Fund manager Anthony Ward, nicknamed “Willy Wonka” and “Chocolate Finger,” is said to have bought around 240,000 tons of cocoa in an attempt to corner the market.
•Compared to price levels in early 2009, cocoa prices in London and New York rose by more than 150 percent and reached their highest level since 1977. A ton of cocoa cost more than 3,600 USD in July 2010—an increase of more than 500 percent compared to 2002. It was a successful bet for Chocolate Finger.
35 Copper: King of the Congo 2010
The copper belt of the Congo is rich in natural resources, but countless despots have looted the land. Now Eurasian Natural Resources Corporation (ENRC) is reaching out to Africa, and oligarchs from Kazakhstan aren’t shy about dealing with shady businessmen or the corrupt regime of President Joseph Kabila.
“The West exploited Africa and now it wants to save it. We have been living with this hypocrisy for too long. Africa can only be saved by Africans.” —Joseph Kabila, President of the Democratic Republic of the Congo
“We bought an asset from the Democratic Republic of Congo that was for sale.” —Sir Richard Sykes, ENRC
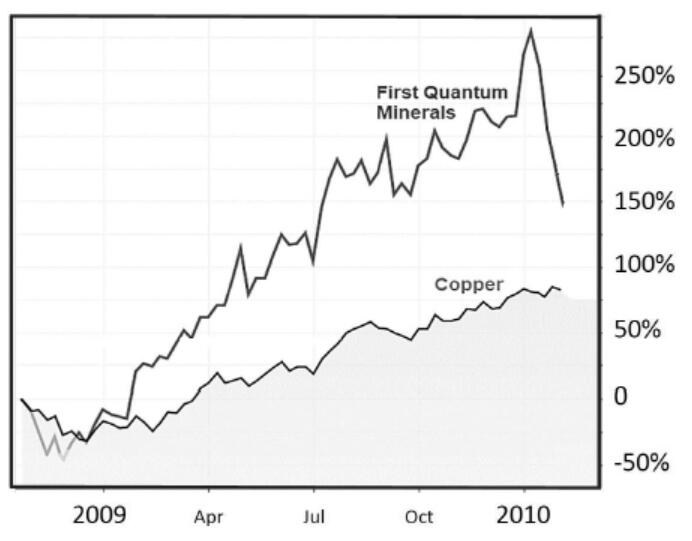
On Friday, August 20, 2010, investors in the city of London listened closely as Eurasian Natural Resources Corporation (ENRC), a 12 billion USD, London-listed Kazakh mining company, took over the majority stake in Camrose Resources, which held the Kolwezi mining licenses recently expropriated by the government of the Congo. The previous owner of the extremely lucrative licenses? The Canadian mining company First Quantum Minerals. This was explosive news!
All of a sudden, after decades of colonialism, dictatorship, and warfare, the Democratic Republic of the Congo (DRC) was once again the focus of media attention and the international mining industry. The Congo, one of the poorest countries in the world, nevertheless has an immense wealth of natural resources. The African copper belt stretches from the Congolese mining province of Katanga to northern Zambia. Here lies around 10 percent of the world’s copper reserves. And in 2010, copper was scarcer and more expensive than ever before: Based on its 52-week low, the price of the metal had increased that year alone by 50 percent. For the first time, copper traded above 9,000 USD per metric ton on the London Metal Exchange (LME).
An Introduction to the Congo
The Democratic Republic of the Congo, formerly Zaire, is the third-largest country in Africa, after Sudan and Algeria. Neighboring countries—the (formerly French) Republic of the Congo, the Central African Republic, Sudan, Uganda, Rwanda, Burundi, Zambia, Tanzania, and Angola—are all much smaller. With its wealth of natural resources, such as cobalt, diamonds, copper, gold, and other rare minerals, the Congo is a prime example of the “resource curse” thesis: The 70 million inhabitants of the Democratic Republic of the Congo are among the world’s poorest. Only Zimbabwe has a lower per capita GDP.
The Congo, whose capital is Kinshasa, gained independence from Belgium in 1960 under President Kasavubu and the popular Prime Minister Patrice Lumumba. A period of instability and military intervention followed, beginning in 1965, under the long dictatorship of Mobutu Sese Seko, during which Mobutu and the elite of the country (now called Zaire) systematically looted the wealth of the nation.
The system collapsed in 1997, when Mobutu was ousted by Laurent-Désiré Kabila. In January 2001, L.-D. Kabila was murdered by one of his bodyguards under unclear circumstances, and the presidency passed to his son, Joseph Kabila. The latter stayed in power until the end of 2018. In January 2019, opposition leader Felix Tshisekedi was declared the fifth president of Congo-Kinshasa since its independence of Belgian colonial supremacy.
Despite the official end of the second Congo war in July 2003 (the first took place in 1997–1998), conflicts still persisted in the country up until today. In the course of this “African World War,” which involved eight African states and 25 armed groups, more than 5 million people died. It was the bloodiest armed conflict since World War II.
The Kamoto Mine near the town of Kolwezi is in the heart of the Congo’s mining district, where more than 3 million tons of copper and more than 300,000 tons of cobalt are believed to be in the ground. The current market value of copper reserves alone exceeds 30 billion USD. When the mine was still in operation, the machines of state-owned mining company Gécamines, once the largest company in Africa, moved about 10,000 tons of rock each day. In September 1990, however, the central part of the mine collapsed, burying many miners. The operation came to a standstill. Under the Mobutu dictatorship, reinvestments were neglected, and the largest mines fell into decay. In the late 1990s, Gécamines sold most of its projects to international mining corporations.
Beginning in 2007, the Congolese government undertook a review of more than 60 foreign mining agreements in order to increase state involvement and ownership in the mining sector. Since then, the revision of mining licenses has created multiple sources of conflict.
The government was aiming for at least 35 percent government ownership in future mining projects. In addition, newer regulations called for a signing bonus of 1 percent of the project value, a 2.5 percent license fee on the gross income, and a stipulation that the mine would go into production within two years.
The value of the mineral reserves of the African copper belt between the DRC and Zambia exceeded the GDP of half the African continent.
In August 2009, after a 2½-year review by the government, Canadian First Quantum Minerals’ Kolwezi license was terminated. The government accused First Quantum of breaching the 2002 mining regulations, though First Quantum denied it. One of the contentious issues was the increase of the Gécamines’ share by 12.5 percent—for zero costs involved.
The situation for the Canadian company was precarious, since it had already invested more than 700 million USD in expanding Kolwezi. Moreover, after First Quantum couldn’t come to an agreement with the Kabila government, the Congolese Supreme Court also revoked the company’s licenses for the Frontier and Lonshi mines in favor of the state mining company Sodimico—another bitter blow to First Quantum.
Sly Foxes
The wealth of natural resources in the Katanga province of the Congo smoldered into a power struggle among the three craftiest businessmen on the continent: George Forrest, Billy Rautenbach, and Dan Gertler. Sixty-seven-year-old Forrest, head of the Forrest Group, had been born in the Congo and was the old man of the Congolese mining industry. In early 2004, a few months after the end of the war in the Congo, Forrest and Kinross Gold entered into a joint-venture agreement with the government over the Kamoto Copper Company (later Katanga Mining).
Rautenbach, founder of Wheels of Africa, the largest transport company in southern Africa, was a friend of Zimbabwean president Robert Mugabe. He went after the jewel, Katanga Mining, through the British company Camec. However, after a short takeover battle, the Congolese government announced a review of those mining licenses, and Rautenbach took the hint. He pulled back in September 2007. Rautenbach had previously been the manager of Gécamines but was replaced by Forrest, which accounted for the hostility between the two men.
Meanwhile, Gertler was laughing on the sidelines. Just 30 years old, he closed a joint-venture contract with the government of the Congo in 2004 for the development of KOV (Kamoto-Oliveira Virgule, later the company Nikanor). KOV was the only mine in Katanga with more resources than Kamoto Copper Company. More than 6.7 million metric tons of copper and 650,000 tons of cobalt—twice as much as in Kamoto—were estimated to be in the ground. According to market prices in 2018, the value of these resources alone exceeds half the GDP of Africa.
During the takeover battle for Katanga, Gertler bought shares in that mine through Nikanor. Camec finally lost its bid at the beginning of 2008, and Nikanor and Katanga Mining merged. In addition to his financial resources, Gertler had excellent connections: He is the grandson of the founder of Israel’s diamond exchange, a friend of then-Israeli prime minister Ariel Sharon, and the same age as Congo president Joseph Kabila, whom he considered a close friend.
In January 2010 the newly established Highwinds Properties, owned by Dan Gertler, was awarded the Kolwezi license in a shady deal. A few months later came the bombshell. On August 20, 2010, ENRC confirmed that it had secured the licenses to Kolwezi through its 50.5 percent acquisition of Camrose Resources for 175 million USD. The company said it intended to cooperate with Cerida Global, another Dan Gertler–controlled company. With the acquisition of Camrose, ENRC was also committed to a 400 million USD loan for Highwinds and a loan guarantee of another 155 million USD for Cerida’s debts.
The Kazakh company ENRC aggressively expanded its business in Africa and was not shy about dealing with African despots like Joseph Kabila.
Camrose also offered a majority stake in its subsidiary Africo to ENRC, whose copper and cobalt projects were located near its Camec properties. This was of high strategic importance for the Kazakh company, since ENRC had acquired the Central African Mining and Exploration Company (Camec) for 955 million USD in 2009. This is where Dan Gertler came into play, as Camec was 35 percent owned by the Israeli investor, who quickly unified the three Kazakh oligarchs—Alexander Mashkevitch, Patokh Chodiev, and Alijan Ibragimov—who owned 40 percent of ENRC.
The deals between Camec and Camrose were important milestones for ENRC’s aggressive expansion policy in Africa, along with a 12 percent stake in Northam Platinum in South Africa that ENRC acquired in May 2010. Regardless of pending possible expropriations and a skeptical attitude by many institutional investors, only time would show whether ENRC would have a more favorable outcome in Congo than its Canadian rival, First Quantum.
Sometimes time flies. In November 2013, ENRC delisted its shares from the London stock exchange. The following April, an official investigation into bribery and sanction-busting began in England, and the founding partners decided to take the company private again. In February 2014, news spread that the company needed to sell all its international assets—including the copper mines in the Democratic Republic of the Congo—to repay debts. President Kabila, however, stayed in power until the end of 2018.
In January 2019, the opposition leader Felix Tshisekedi was declared the fifth president of Congo-Kinshasa. Leader of the opposition, Martin Fayulu, complained that Kamila, despite officially stepping down from office, would with his associates most likely continue controlling the levers of powers. Presidential elections had been due for more than two years, but elections had been postponed several times despite forceful protests. Since the end of Belgian colonial supremacy in 1960, the country had never seen a peaceful transfer of power.
Key Takeaways
•The African copper belt that runs between the Congo and Zambia holds an incredible wealth of natural resources. In 2010 it became the focus of upheaval when President Kabila revoked the mining license of Canadian firm First Quantum Minerals.
•Copper was now big business, as copper prices traded at record highs of more than 9,000 USD per ton on the London Metal Exchange (LME).
•The Kazakh (but London-listed) resource company Eurasian Natural Resources Corporation (ENRC) began to massively expand its footprint in Africa. The firm’s leaders were willing to deal with shady businessmen as well as with President Kabila’s corrupt regime.
•In a murky transaction involving Dan Gertler’s Highwinds Properties, the expropriated assets of First Quantum were sold to ENRC. International investors were shocked, and the company went private a couple of years later.
36 Crude Oil: Deep Water Horizon and the Spill 2010
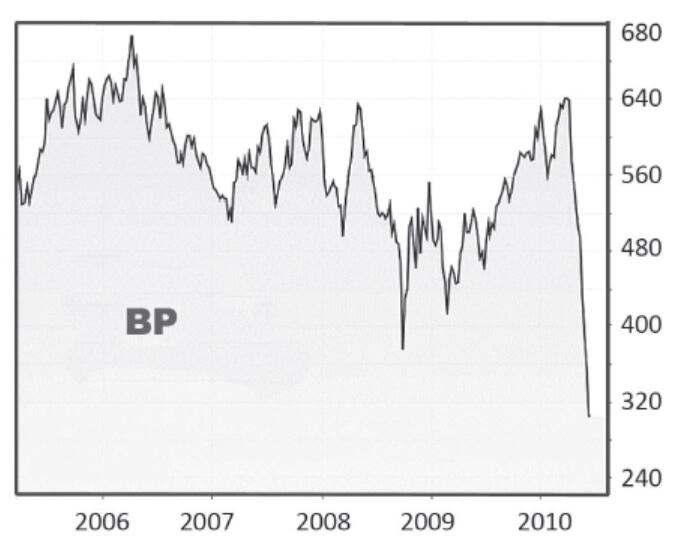
Time is pressing in the Gulf of Mexico. After a blowout at the Deepwater Horizon oil rig, a catastrophe unfolds—the biggest spill of all time. About 780 million liters of crude oil flow into the sea. Within weeks BP loses half its stock-market value.
“This well did not want to be drilled . . . it just seemed like we were messing with Mother Nature.” —Daniel Barron, survivor of the Deepwater Horizon disaster
“I would like my life back.” —Tony Hayward, CEO of BP
Deepwater Horizon was one of the world’s most advanced deepwater rigs. Installed in 2001, it was 121 meters long, 78 meters wide, and 23 meters high and cost 350 million USD. In April 2010, the giant lay about 40 miles off the coast of Louisiana in the Gulf of Mexico. Since February, the platform had been busy in the Mississippi Canyon Block 252, drilling in the Macondo reservoir about 4,000 meters below sea level.
April 20, 2010, promised to be a successful day, because the drill hole identified as API Well No. 60-817-44169 was about to be completed. The well would be sealed and prepared for production by a production platform. Every day counted because platform operators like Transocean charged oil companies on a daily basis. And in this case, BP was already concerned because Deepwater Horizon had been behind schedule for 43 days. The delays had already cost the big oil company more than 20 million USD.
Twenty years after the Exxon Valdez oil spill, an even bigger environmental catastrophe was looming on the horizon.
The Exxon Valdez—A Past Catastrophe
Shortly after midnight on March 24, 1989, the most severe environmental disaster in the history of the United States occurred. The 300-meter-long oil tanker Exxon Valdez was on its way from the oil-loading station of the Trans-Alaska Pipeline, in the port city of Valdez, Alaska, when it collided with Bligh Reef in Prince William Sound. The accident caused a spill of almost 40,000 tons of crude oil. Around 2,000 km of coastline were contaminated, and hundreds of thousands of fish, seabirds, and marine animals died. Captain Joseph Hazelwood was drunk in his room at the time of the accident, and third officer Gregory Cousins had the bridge.
Despite an extensive cleanup, the ecosystem remains severely disturbed three decades later.
That morning, four BP managers arrived by helicopter to monitor the completion of the drilling. Only a few hours before, experts from the oil services company Halliburton had cemented the drill hole closed, but employees of Schlumberger, who were about to test the cement seal, were sent back to shore by the BP managers before they had accomplished their task.
Deepwater Horizon drilled for black gold in the Gulf of Mexico on behalf of BP.
To accelerate completion of the work, BP urged rapid replacement of the drilling mud in the well with seawater to prepare for early production. This decision precipitated an argument between BP and the Transocean managers, who considered that step premature. Unlike seawater, drilling mud holds back rising gas and oil. However, the managers of BP prevailed, and the work began.
The decision would prove disastrous. The hole had a leak, and drilling mud and gas bubbles began to spill out. The cement plug also appeared to be leaking. Work continued into the night, until suddenly a sharp hiss of methane was heard and a fountain of mud shot out of the derrick, signaling a blowout.
As the methane ignited, a huge column of flame rose into the sky. Suddenly the entire derrick was on fire, and four workers on the drilling deck were dead.
The alarm sensors designed to warn of fire and a concentration of toxic or exploding gases had been turned off to keep workers from being disturbed by false alarms in the middle of the night. Now, below deck, it was chaos. Workers, some of them barely awake and dressed in little more than a life jacket, were jumping off the platform into the water, trying to save themselves. But with the Deepwater Horizon in flames, the oil on the water’s surface had caught fire as well. Chaos also reigned in the rig’s two lifeboats.
Around 11 pm, the Damon B. Bankston, an 80-meter-long supply ship, rescued the survivors. Eleven people had died in the explosion. Two days later, the oil platform sank in the Gulf of Mexico.
The demise of the platform marked the beginning of the biggest environmental disaster in the history of the United States, an event that would provide the plot for a Hollywood blockbuster movie, starring Mark Wahlberg, in 2016.
The Macondo drilling ended in disaster. In the largest oil spill in the United States, nearly 780 million liters of crude oil ran out, and the market value of BP fell by half.
When fire broke out on the deck of the Deepwater Horizon, engineer Christopher Pleasant pressed the emergency button for the blowout preventer (BOP), a series of shut-off valves mounted directly above the well bore to interrupt the flow of oil into it. Like huge pliers, the massive shear jaw of the BOP was supposed to cap and close the well in case of disaster. The automatic emergency system was activated, but nothing happened.
A commission of inquiry later found that the Deepwater Horizon blowout preventer was poorly maintained, the hydraulic system was leaking, and the safety instructions had not been properly maintained. In addition, the ring valve of the device had been damaged weeks before. Not only was the blowout preventer in poor condition, as early as September 2009, BP had reported almost 400 defects on the rig to Transocean. However, maintenance had been delayed, and more than 26 systems were in poor condition. There were even problems with the ballast system.
After the platform sank, an oil slick formed. Approximately 1.5 km by 8 km at first, it expanded to almost 10,000 square kilometers within a few days. Between 5 and 10 million liters of crude oil were flowing out every day, and Louisiana, Florida, Mississippi, and Alabama all declared a state of emergency. According to the US Department of the Interior’s Flow Rate Technical Group (FRTG), the amount of oil that flowed out every 8 to 10 days matched the total amount of oil from the Exxon Valdez disaster. BP estimated that there were around 7 billion liters of crude oil in the source. Thus, it would take another two to four years until the entire amount of oil had oozed into the sea.
Shortly after the platform sank, BP initiated two independently made side-to-side relief wells (called the “bottom-kill method”), but the drilling would have taken about three months. Meanwhile, the capture of the oil with the aid of large steel domes was failing.
The depth of the seabed—around 1,500 meters—complicated the work. At the end of May 2010, several attempts were made to plug the leak with mud and cement (the “top- kill method”), but they, too, were unsuccessful. In the middle of July, BP succeeded in significantly reducing the oil flow with a new sealing attachment—a temporary closure was successful. As a result, on August 6, the leak was finally sealed permanently using a modified variant of the top-kill method (“static-kill”)—pumping in liquid cement through side relief holes. On September 19, five months after the Deepwater Horizon sank, BP declared the well “officially dead.”
It took five months to seal the oil leak.
It was estimated that nearly 5 million barrels of oil, around 780 million liters, had run out, and BP’s stock-market value fell by half in the course of the disaster. The company announced that it would divest 10 billion USD worth of assets to defer the cost of the spill.
At that point only about 3 billion USD in costs had accumulated. But BP also set up a trust fund of more than 20 billion USD for the future consequences of the catastrophe. Still unanswered is the question of who bears the responsibility for the disaster. Undoubtedly, BP took high risks, applied non-industry-compliant practices to save costs, and, as the principal, bears the financial responsibility. Transocean’s role as operator of the oil platform also needs to be clarified, especially since the platform was in relatively poor condition. For Halliburton, the questions revolve around the doubtful completion of the cement seal of the well, and initial claims have also been made to BP’s partner companies Mitsui and Anadarko.
The disaster heightened public awareness of the risks associated with deepwater drilling, both in the Gulf of Mexico and in planned projects off Brazil and Africa. As a direct result of the catastrophe, the US government passed a deep-sea moratorium, temporarily banning all new deep-sea drillings. Although this was later repealed, no new licenses have been awarded. As a further consequence, President Barack Obama fired the head of the Minerals Management Service, Elizabeth Birnbaum. The agency, now renamed the Bureau of Ocean Energy Management, Regulation and Enforcement, had grossly and negligently violated its oversight responsibilities.
It is impossible to estimate the economic consequences of the disaster, let alone the environmental consequences, which include not only the direct effects of the oil pollution but also the burning of oil and the use of toxic chemicals like Corexit, which have been used to combat the oil spill. BP said in 2018 that it would take a new charge over the Deepwater Horizon spill after again raising estimates for outstanding claims, lifting total costs to around 65 billion USD. The story of the disaster in the Gulf of Mexico will play out for decades in the future.
Key Takeaways
•At the Deepwater Horizon oil rig in the Gulf of Mexico, the Macondo drilling, at about 4,000 meters below sea level, ended in disaster. Nearly 780 million liters of crude oil ran out, and the market value of BP, the oil and gas company in charge, fell by half within weeks.
•The oil spill caused the biggest environmental catastrophe in the history of the United States, far more devastating than the oil spill of the Exxon Valdez 20 years earlier.
•As a consequence, US authorities temporarily froze all deepwater drilling licenses. BP is estimating a price tag of more than 65 billion USD.
37 Cotton: White Gold 2011
The weather phenomenon known as La Niña causes drastic crop failures in Pakistan, China, and India due to flooding and bad weather conditions. Panic buying and hoarding drive the price of cotton to a level that has not been reached since the end of the American Civil War 150 years ago.
“It’s not something you’re going to see again in your lifetime.” —Sharon Johnson, senior cotton analyst
“I think there’s still hope for prices to go higher.” —Yu Lianmin, Chinese cotton farmer
In ancient Babylon, cotton was known as “white gold,” and the fabric has remained popular throughout history, woven by hand for hundreds of years. At the end of the 18th century, however, spinning and weaving mills began to produce fabrics and clothing at a much lower cost than could be done by hand. By the 19th century, the cotton business was booming, due to recent inventions such as the steam engine, the cotton gin, the spinning jenny, and mechanical looms.
The textile industry of the United Kingdom required ever larger quantities of the raw material, which was produced in its colonies or elsewhere abroad, especially in the southern United States, where cotton had expanded tremendously in the early 1800s. The crop thrived everywhere that was moist and warm, and labor was cheap in the American South. For about 250 years enslaved Africans had toiled on southern plantations, and cotton production grew from just 10,000 bales a year to more than 4 million until slavery was abolished after the end of the American Civil War in 1865. During that war, the price of cotton rose to dizzying heights that would only be reached again in spring 2011, almost 150 years later.
The last time cotton reached almost 2 USD per pound was after the American Civil War.
Since 1995, cotton had traded mostly between 0.40 and 0.80 USD, but at the end of September 2010, for the first time in 15 years, the price of cotton broke the 1 USD/lb level. A few months earlier, in May, the German magazine Der Spiegel had bemoaned “the end of cheap jeans,” as it noted the price explosion in cotton. But that was only the beginning. By November, cotton prices had increased another 40 percent. A sharp correction followed, but by the end of December cotton was up to 1.40 USD. And, beginning in January 2011, the market was unstoppable. The price spiked to more than 2.15 USD in March 2011—four times the level of early 2000 and a 480 percent increase over the November 2008 price.
It was the highest price ever paid for cotton since the introduction of cotton trading on the New York Cotton Exchange in 1870.

The price had actually been rising for several years. At the end of 2009, the global textile industry had forecast robust growth of around 3 percent for the following year. However, flooding and bad weather conditions in several important producer countries such as China, India, Pakistan, and Australia led to significant crop losses. Because of the falling inventory, high premiums were paid for material that was available in the short term.
Once again, severe weather conditions influenced agriculture prices.
In Pakistan, the world’s fourth-largest cotton-producing country, floods hit more than 14 million people in 2010, according to UN estimates. The exceptionally heavy monsoon season was considered the strongest in more than 80 years, and rain destroyed more than 280,000 hectares of cotton. According to the Pakistan Cotton Ginners Association, the flood destroyed 2 million bales of cotton. The All Pakistan Textile Mills Association also reported a worrying shortage of cotton. Only 30 percent of the mills had raw material in stock for the next 90 days, and Pakistan would soon stop exporting cotton.
A few weeks later, India, the second-largest cotton producer in the world, followed suit. The Indian Ministry of Textiles stopped exports, since without the ban the Indian textile industry would not have been guaranteed an adequate supply of cotton. Indian exports dropped to 0.5 million metric tons, having exceeded 1.5 million tons in the 2007–2008 season.
There were several reasons for the shortage beyond the dynamic growth of the domestic Indian textile industry. The world’s largest cotton producer and importer, China, was also enduring a shrinking cotton harvest for the second year in a row, due to low temperatures and too much rain. China Cotton Association statistics in December 2010 showed monthly imports doubling year over year.
Cotton Basics
Most cotton species and varieties are cultivated as annual plants and have high requirements for heat and water. In the Northern Hemisphere, sowing takes place from the beginning of February to the beginning of June, depending on the location.
China, India, the United States, Pakistan, Brazil, and Uzbekistan together account for around 85 percent of the world’s cotton production, with China and India producing more than half of the global market volume. In the 2009–2010 harvest, the amount of cotton grown worldwide reached 25 million metric tons.
Cotton is used mainly in textiles, accounting for about one-third of the world’s textile fibers. These can be categorized into natural fibers—such as vegetable fibers (e.g., cotton or linen) and animal fibers (e.g., wool, hair, and silk)—or artificial (synthetic) fibers. Synthetic fibers actually dominate the industry, accounting for almost 60 percent. They can be divided into cellulosic fibers (e.g., viscose) and those derived from petroleum. The most important synthetic fibers are polyester, polyamide, and polyacrylic fibers.
Cotton is traded on the commodity futures exchanges in the United States under the symbol CT and the respective contract month in a contract size of 50,000 lb per contract.
In late 2010 and early 2011, flooding and Cyclone Yasi caused severe damage in Australia, which ranked eighth among the top 10 cotton producers worldwide. The Australian Cotton Shippers Association, which had predicted a bumper harvest of more than 4 million bales, reduced its forecast by more than 10 percent.
Blocks on cotton exports worsened the situation, and panic buying and hoarding were the result.
Cotton processors in the region reacted in panic. Willing to pay any price for raw material, they pushed prices ever higher. Cotton farmers who still had inventory continued to aggravate the situation. The China National Cotton Information Center estimated that around 2 million tons of available material never reached the market in China. For example, in Huji, in Shandong province, about 220 kilometers from Beijing, growers held back more than 50 percent of their harvest at the end of January, expecting prices to continue to rise. Because of the short shelf life of cotton, that strategy could only be maintained until April or May.
In any case, the price boom in cotton was short lived. The International Cotton Advisory Committee in Washington estimated that the acreage for the 2011–2012 season would increase to 36 million hectares, the most in 17 years. It was a natural response to record prices. In the short term, however, most processors had no choice but to mix cheaper synthetic fibers with the more expensive cotton.
Key Takeaways
•If you thought that the exciting times of trading cotton took place more than 100 years ago, events in 2010 proved you wrong.
•The first impacts of global climate change were evident in a series of extreme weather events. Flooding and bad weather conditions caused by La Niña accounted for significant crop losses in several important cotton-producing countries, such as China, India, Pakistan, and Australia.
•Cotton processors in the region reacted in panic, driving prices higher. Cotton farmers who still had stocks held back their supply in expectation of even higher profits.
•As a consequence, cotton prices shot through the roof. Cotton, which once traded at 40 US cents per pound in 2009, doubled in value within a year to 80 US cents and skyrocketed to 2 USD in 2011. This was an increase of 500 percent in two years!
•Because of short supplies, export restrictions, panic buying, and hoarding, the price of cotton rose to a level not reached since the end of the American Civil War 150 years ago.
38 Glencore: A Giant Steps Into the Light (2011)
In May 2011, the world’s largest commodity trading company—a conspicuous and discreet partnership with an enigmatic history—holds an IPO. The former owners, Marc Rich and Pincus Green, have been followed by US justice authorities for more than 20 years. Without mandatory transparency or public accountability in the past, they were able to close deals with dictators and rogue states around the world.
“Glencore is Marc Rich’s legacy.” —Daniel Ammann, author of The King of Oil
“My business is my life.” —Marc Rich
It was the week before the Easter holidays in 2011, on a warm, sunny day in the banking metropolis of Frankfurt am Main, Germany. For the first time that year, temperatures climbed above 72 degrees Fahrenheit, and the city was full of people enjoying the sun’s warm rays. It was also the first week of “investor education” concerning the biggest IPO of the year, for Glencore.
Equity sector specialists were explaining corporate strategy and the business model of the world’s largest commodity trading house and the reasons why institutional investors should participate in its initial public equity offering. In a meeting room in one of the bank towers, high above the city center, 11 people nibbled on light snacks. The analyst was late, however, thanks to too many meetings and telephone conferences. And much of the information about corporate returns remained unclear. It seemed that Glencore was not being completely transparent. How exactly did the commodity giant—whose value was estimated at between 60 and 80 billion USD by the banks in the consortium and whose management team was known only to industry insiders—earn its money? Until the IPO, the Switzerland-based company had cherished one thing above all: secrecy.
Glencore (the name was derived from Global Energy Commodity Resources) was one of the world’s leading commodity players. Its business activities included the production, processing, and trading of aluminum, copper, zinc, nickel, lead, iron ore, coal, and crude oil as well as agricultural products. In terms of sales, the company was the largest in Switzerland and the largest individual shareholder, with 33 percent, of the multinational mining company Xstrata. Before the IPO, Glencore was completely owned by its management and employees, but until 1993 it had had a turbulent history determined by only one man: Marc Rich, nicknamed “The King of Oil.”
Marc Rich was the world’s most successful commodity trader. Together with Pincus Green, he broke the Seven Sisters cartel, the dominant oil companies until the 1970s.
Within commodity markets, Marc Rich was a legend. No commodity trader before or after him has ever been so successful. As a son of German-speaking Jews, Rich began his career in 1954 with Philipp Brothers, then the world’s largest commodity trader. Strong economic growth in Europe, the United States, and Asia made the 1960s a boom decade for commodity trading. But in 1973, when the company earned a record profit in which Marc Rich and Pincus Green played a decisive role, a dispute about future payments arose.
Rich and Green left Philipp Brothers and convinced Jacques Hachuel, Alexander Hackel, and John Trafford to follow them. Together they founded Marc Rich + Co AG in Zug, Switzerland, on April 3, 1974.
Rich and Green revolutionized commodity trading, breaking the multinational Seven Sisters oil companies cartel and becoming major players in international petroleum trading. In the early 1980s Rich was the world’s largest independent oil trader. Marc Rich + Co generated more profit than UBS, the biggest bank in Switzerland, and Rich’s private wealth was estimated to total more than a billion USD.
Initially, the company focused on the physical trading of iron, nonferrous metals, and minerals. Crude oil and coal marked an expansion into energy. With the acquisition of an established Dutch grain distribution company in 1982, Rich + Co also entered the agricultural sector. Through further acquisitions in mining, smelting, refineries, and processing, the company continued to grow in the 1980s and 1990s.
Who Was Marc Rich?
Marc Rich, born Marcell David Reich on December 18, 1934, in Antwerp, Belgium, was the son of German-speaking Jews. Fleeing war and persecution, the family immigrated to the United States and changed the family name to Rich. As a young man, Rich studied at New York University but left after two semesters to join Philipp Brothers in 1954, then the largest commodity trading company in the United States. He started his career under Ludwig Jesselson, and between 1964 and 1974 he worked as a manager of the Philipp Brothers offices in Spain. In 1974 Rich left the company and with Pincus Green and others founded Marc Rich + Co AG.
Within the next two decades, the new commodity trading company would become the most successful in the industry. But because of business ties to Iran—despite American political and economic sanctions and the US abolition of diplomatic relations in April 1980—Rich and Green became the focus of the US Justice Department. Accused of organized crime and tax fraud, Rich avoided prosecution by fleeing to Switzerland, where for 20 years he and Green proceeded with business as usual, while they were pursued by US justice.
After a management buyout in 1993, Rich separated from the firm, and the group was renamed Glencore. At the time, Forbes magazine estimated his private assets at more than 1.5 billion USD.
Rich never went to trial, and on his last day of office, January 20, 2001, President Bill Clinton granted full and unconditional pardons to Rich and Green in a still-controversial act.
In June 2013, Rich died of a stroke at a hospital in Lucerne, Switzerland, at the age of 78.
As it hunted for the next source of profits, the company was not picky. The list of its business partners read like a “Who’s Who” of international rogue states and dictatorships. The company traded commodities with Iran during the hostage crisis and with Fidel Castro’s Cuba, as well as with Slobodan Milosevic’s Yugoslavia, North Korea, Muammar Gaddafi’s Libya, the Soviet Union under Brezhnev, South Africa’s apartheid regime, and Nigeria and Angola in the late 1970s.
In the 1990s, though, the tables turned. Pincus Green and Alexander Hackel resigned, and the press relentlessly excoriated the company’s business behavior. Finally, after heavy trading losses, Rich lost the support of other senior managers.
In November 1993, the 39 most important employees of Marc Rich + Co met at the Parkhotel in Zug to discuss the future of the company without Rich. Led by Willy Strothotte, they agreed on a management buyout, and by the following November, Rich had gradually sold his shares of the firm to management and senior employees, about 200 people in all. The value of the company—an industry leader in trading crude oil, metals, and minerals—was estimated to be between 1 and 1.5 billion USD. The new owners renamed the company Glencore, eliminating all traces of the Marc Rich name after 20 years.
Strothotte took over as chairman of the board of directors of Glencore but also moved into a top position at Schweizerischer Südelektra, which was renamed Xstrata in 1999 and was 33 percent owned by Glencore. The two companies maintained a close relationship. While Xstrata concentrated on commodity production, Glencore focused on marketing and trading raw materials. Xstrata, listed in London, offered transparency for investors. However, Glencore’s business continued to play out behind the scenes.
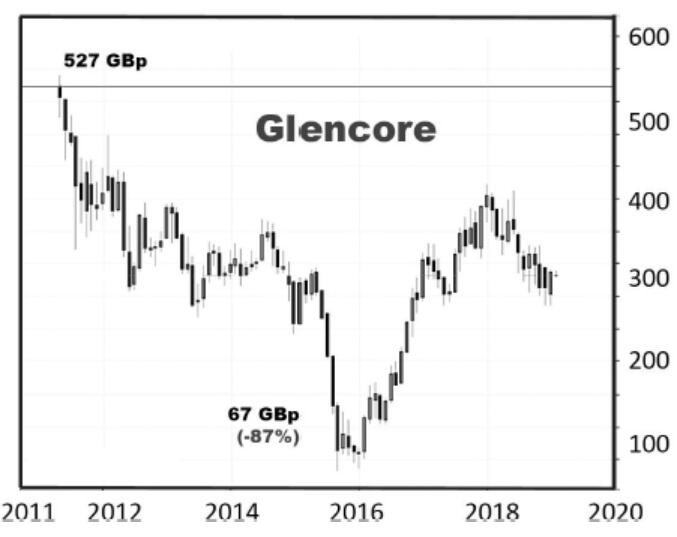
As Glencore reached the limits of growth within its corporate structure, it badly needed fresh capital, a situation exacerbated by the fact that some of the management team had to be reimbursed within the next couple of years. The initial public offering, which raised 12 billion USD, satisfied that hunger for cash. On May 19, 2011, shares of Glencore were listed for the first time in London at 5.27 GBP. In February 2012, the company announced a merger with Xstrata that would be concluded almost a year later under CEO Ivan Glasenberg. The CEO of Glencore since 2002, Glasenberg had been with the company since 1984 and, with an estimated 5 billion USD net wealth, he became one of the top 10 richest people in Switzerland.
It turned out that Glencore’s management had cashed out at the peak of the cycle: The share price of the initial IPO has never been reached again. Instead, during a commodity sell-off, shares plunged to 67 GBP on September 28, 2015, a loss of 87 percent since the IPO. In January 2019, however, Glencore’s share price had recovered to 3 GBP, which shows that its business model as a listed company was working.
Key Takeaways
•The commodity trading company Glencore had a turbulent history that, until 1993, was determined by one man—Marc Rich, nicknamed “The King of Oil.” Rich had founded Glencore’s predecessor company, Marc Rich + Co AG, in Zug, Switzerland, in 1974.
•With private wealth of more than 1 billion USD, Rich became the most famous commodity trader by breaking the Seven Sisters cartel, and by becoming the world’s largest independent oil trader. His list of business partners read like a “Who’s Who” of international rogue states and dictatorships.
•Glencore and other commodity trading companies generally maintain an aura of secrecy, since they prefer to strike their deals in private. However, to overcome financing constraints, Glencore, which was completely owned by its management and employees after 1993, raised 12 billion USD in its initial public offering in May 2011. It merged with mining giant Xstrata one year later and became a leader in both mining and commodity trading.
•In May 2011, shares of Glencore were listed for the first time in London at 5.27 GBP. In hindsight, that was the top of the cycle; during the following bear market in commodities, the shares plunged to 0.67 GBP in September 2015. Today, shares of Glencore have recovered to 3 GBP.
39 Rare Earth Mania: Neodymium, Dysprosium, and Lanthanum 2011
China squeezes the supply of rare earths, and high-tech industries in the United States, Japan, and Europe ring the alarm bell. But the Chinese monopoly can’t be broken quickly. And the resulting sharp rise in rare earth prices lures investors from around the globe.
“The Middle East has oil. China has rare earths.” —Deng Xiaoping, 1992
In 2013, geologist Don Bubar bought 4,000 hectares of land in the wilderness of Canada for less than half a million USD, hoping that in a few years the area would be worth billions. Bubar and his company, Avalon Resources, planned to develop a mine for rare earths and to start production by 2015. Gold fever had seized the mining industry. Almost 300 companies worldwide were exploring for rare earths and other exotic metals like lithium, indium, or gallium. Investors were happy to spend their money on these projects, because the supply of rare earths is limited, demand was high, and prices were soaring, reflected in press headlines almost every day.
Rare earths have become indispensable for modern high-tech applications—in computers, mobile phones, or flat screens, for example, and the growth of regenerative energy can’t be achieved without rare earths in electric/hybrid cars or in wind power plants. But these metals have been at the center of a trade conflict between the main producer, China, and the industrialized countries, a situation that has been worsening over the past few years.
What Are Rare Earths?
Rare earths consist of 17 metals: scandium, yttrium, and the lanthanides group of lanthanum, cerium, dysprosium, europium, erbium, gadolinium, holmium, lutetium, neodymium, praseodymium, promethium, samarium, terbium, thulium, and ytterbium. In most deposits, light rare earths (cerium, lanthanum, neodymium, and praseodymium) are found in large quantities, while the occurrence of heavy rare earths (yttrium, terbium, and dysprosium among others) is considerably lower.
One of the most extensively used metals is neodymium, which is indispensable for the production of permanent magnets, that is, magnets that do not discharge. Neodymium is used in mobile phones and computers, wind turbines, and electric/hybrid cars. Each megawatt of power from a wind generator requires between 600 and 1,000 kg of permanent magnets made of iron-boron-neodymium alloys. Moreover, in every wind turbine, there are several hundred kilos of neodymium and dysprosium.
Lanthanum is also used in many high-tech applications. For example, about one kg of neodymium is needed for the hybrid engine of a Toyota Prius, but the batteries contain about 15 kg of lanthanum. The German Federal Institute for Geosciences and Natural Resources expects the demand for rare earths to rise to 200,000 metric tons a year. At current prices, this means a market size of 2 billion USD. Compared to other metal markets, such as that for copper, with an annual production volume of almost 20 million metric tons and a market value of almost 140 billion USD, rare earths are a tiny but profitable segment.
China has dictated world market prices of rare earths, since its production accounts for about 97 percent of the global volume of 120,000 tons per year. China also has almost 40 percent of the world’s reserves, while other significant reserves are located in Russia, the United States, Australia, and India.
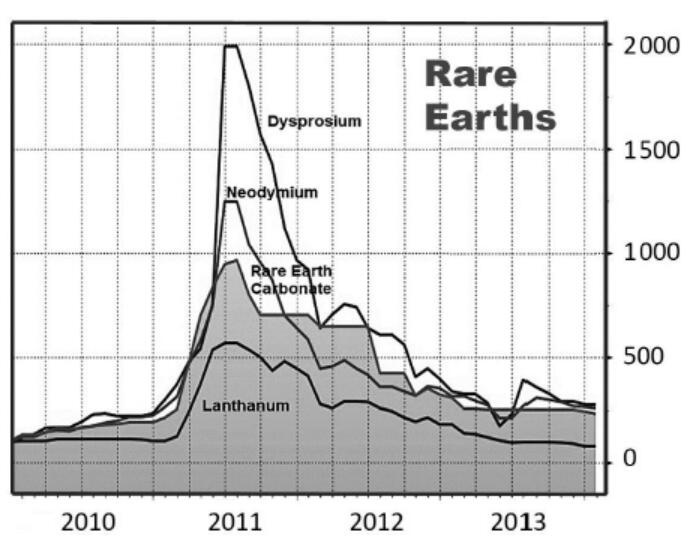
Similar to OPEC’s actions during the oil crises of the 1970s, China has been manipulating exports for years, and the United States, Japan, and Europe have all complained about export restrictions and high export duties. In 2005, exports were around 65,000 metric tons per year, but the volume has shrunk dramatically since then. As a result, prices for rare earths rose sharply from 2005 to 2008, and there was another price push in the third quarter of 2009. For the first half of 2011, the Chinese government announced exports of just 14,500 metric tons, and prices rose again. A kilogram of neodymium in May 2011 cost almost 300 USD, compared to just 40 USD 12 months earlier.
China also used its dominance in rare earth production as a political weapon. When Japan detained a Chinese ship captain, China banned rare earth exports to Japan in September 2010.
Over the past 20 years, industrialized nations have maneuvered themselves into this economic dependency. In the mid-1960s, the United States began producing rare earths in the Mountain Pass Mine, in the Mojave Desert of California. Until the late 1990s, this mine alone covered the world’s demand for these metals. Within the industry, this time period is known as the “Mountain Pass era.”
However, due to environmental constraints and low prices for rare earth metals, the mine closed in 2002. Since the beginning of the 1990s, the Chinese—able to produce the rare earths more cheaply and without worrying about environmental requirements—have begun to flood the world market.
The main Chinese production comes from Mongolia, where only a few kilometers away from the city of Baotou, with its multimillion population, is Bayan Obo, one of the world’s largest open-air mines.
It is estimated that up to 35 million metric tons of rare earths—more than half of total Chinese production—come from Bayan Obo. Another large segment of the Chinese supply derives from the southern provinces, where there are numerous small illegal projects in addition to official government mines. Production has its price, however. Processing rare earths generates large amounts of poisonous residues, which leads to heavy pollution by thorium, uranium, heavy metals, acids, and fluorides. Thus, untreated sewage has turned the nearby 12-kilometer-long drinking-water reservoir at Baotou into a waste dump enriched with chemicals and radioactive thorium.
Bayan Obo in China is the world’s largest mine for rare earth minerals.
Such heavy environmental damages are ironic, since these rare earths are indispensable to the clean energy industry, especially wind turbines and electric/hybrid cars. There’s no short-term, easy way out of the West’s self-inflicted scarcity. Development of an independent production capacity without environmental problems is a very capital-intensive undertaking. Exploration and exploitation of rare earth deposits is somewhat less problematic; despite their name, rare earths are not really scarce. Even the rarest metal in the group is around 200 times more common than gold.
Skyrocketing prices of rare earths have attracted many adventurers.
Skyrocketing prices in 2011 attracted investors and adventurers around the globe, as small mining companies began to search for rare earths and other exotic metals, and investors looked for attractive rare earth deposits to invest in. However, the majority of new rare earth deposits will never be developed or even have the slightest chance to go into production.
The two most promising companies were Molycorp and Lynas. Molycorp, which had an IPO in 2010, planned to reactivate the Mountain Pass Mine, while Lynas aimed to start production at the Mount Weld Mine in Australia in 2011. All other projects were looking at a planning horizon of at least five years. Meanwhile, the absence of a processing infrastructure was an even greater obstacle than the need for capital-intensive funding.
In 2015, Molycorp filed for bankruptcy after facing challenging competition and declining rare earth prices. The company was then reorganized as Neo Performance Materials. Lynas successfully got into production and made a first shipment of concentrate in November 2012. Today it operates a mining and concentration plant at Mount Weld and a refining facility in Kuantan, Malaysia. In September 2018, however, the processing facilities in Malaysia came under government review because of environmental concerns, and shares of Lynas began to tumble.
China will continue to be the dominant source of rare earths, which perfectly fits into the strategic plan issued by Chinese premier Li Keqiang and his cabinet in May 2015: Made in China 2025.
Key Takeaways
•The group of 17 rare earth metals, with exotic names like neodymium, dysprosium, or lanthanum, have become indispensable for modern high-tech applications like wind turbines and e-mobility.
•In 2011, China squeezed the supply of rare earths, using its dominance in rare earth production as a political weapon. Because its production accounts for more than 90 percent of global supply, China has been able to dictate world market prices.
•High-tech industries in the United States, Japan, and Europe sounded the alarm, but it was impossible to break the Chinese monopoly on the supply of rare earths in the short term. As a consequence, rare earth prices increased sharply, an average of 10 times between 2009 and 2011. Prices of neodymium and dysprosium, which are in the highest demand, increased even more drastically. This price spike attracted global investors who were eager to invest in rare earth deposits.
40 The End? Crude Oil Down the Drain 2016
A perfect storm is brewing for the oil market. There is an economic slowdown and too much storage because of contango. The world seems to be floating in oil, whose price falls to 26 USD in February 2016. But the night is always darkest before dawn, and crude oil and other commodities find their multiyear lows.
“Everybody be cool. You—be cool.” —Seth Gecko in From Dusk till Dawn
“The crude oil supply glut is gone.” —Nick Cunningham, www.oilprice.com
The Armageddon of the global financial crisis had been stopped by the massive bailouts and unconventional monetary policy of central banks around the world. As for oil, WTI crashed from almost 150 USD/barrel in June 2008 and traded temporarily below 33 USD during spring 2009. By the end of that year, crude prices had recovered to 80 USD, and between 2011 and 2014 the reference point for crude oil was 100 USD.
But in hindsight, the summer of 2014 proved to be just the quiet before a massive storm: WTI fell from almost 110 USD to less than 26 USD—a drop of 76 percent, even lower than it had been during the financial crisis. (Actually it was the lowest level for crude prices since 2003.)
Crude oil was not the only victim. The year 2016 began as an ugly one for all commodities as the Chinese domestic stock market plunged, and many other equity indices around the world followed in a case of Asian contagion. Demand in China was of fundamental importance for commodities because of demographics, growth, and the country’s immense raw material purchases. The US dollar retreated massively from highs of 100 on the Dollar Index, and raw material prices dropped further.

The massive price drop during the financial crisis had caused the term structure for crude oil to flip into contango, in which spot prices are below those of future delivery dates. It made more sense to store oil than to sell it, but the glut in supply overtaxed existing holding facilities, eventually leading to the use of supertankers as floating storage.
By the end of summer 2015, crude inventories were still rising and prices had started to crash. In early 2016, storage levels had barely declined from their 80-year highs of 490 million barrels in the United States alone, leading to pessimism about the future.
The International Energy Agency (IEA) noted that crude oil markets could “drown in over-supply” because of rising storage levels around the world. The agency said that the world had added 1 billion barrels of oil in storage in 2015, and storage levels were still rising. Even in the fourth quarter, normally when stocks are drawn down, inventories continued to climb.
Crude oil crashed because of a massive global supply glut. Oil prices fell to less than 26 USD.
There were dire warnings that the world could soon run out of storage space for oil, which would depress prices even further. Oil tumbled to its lowest level in more than 12 years, as the crude stockpiled at the delivery point for New York futures reached a record.
On February 11, 2016, when the S&P 500 index posted a 12 percent loss on the year, the Baltic Dry Index—which measures the shipping activity of dry bulk cargos around the world—fell to an all-time low of 290. The activity in commodity markets came to a halt, and the Bloomberg Commodity Index posted a 30 percent loss on the year. However, February 11 marked the lows for many assets, and the markets began to improve in the weeks and months that followed.
OPEC and Russia agreed to a joint production cut to fight the supply glut. Finally prices started to recover.
Capitulation Price Levels
In early February 2016, the S&P Goldman Sachs Commodity Index and Bloomberg Commodity Index, two important commodity market references, posted double-digit losses. Investors were devastated since 2015 had already been a bloodbath for commodities. Crude oil traded as low as 26 USD/barrel, copper below 2 USD/lb, and even gold traded as low as 1,050 USD/oz. Cryptocurrencies weren’t given much attention from investors at that time. Bitcoins, for example, had a bad year in 2015, trading below 200 BTC/USD, and started to recover in 2016.
Gold was the first among the group of more than 20 commodities to indicate a turnaround, as prices started to climb, and exceeded its 200-day moving average rather quickly, a strong technical indicator for bullish markets.
In the face of the massive supply glut, OPEC and Russia agreed to a joint cut in production. It was OPEC’s first agreed cut since 2008, when oil prices collapsed late in the year after hitting record levels during the summer. And it had the potential to restore some longer-term stability to the global oil market. The wild card was renewed production in the United States, pushed by shale oil and fracking on the back of rising prices. Some feared that this could simply end up prolonging the glut and pushing prices back down.
But there was also evidence that the massive inventories of raw materials were declining, and demand was finally picking up. And demographic trends continued to support the rationale that more people in the world would require more commodities in the years ahead. Both classic economic theory and common sense dictate that as demand rises, inventories fall and prices rise.
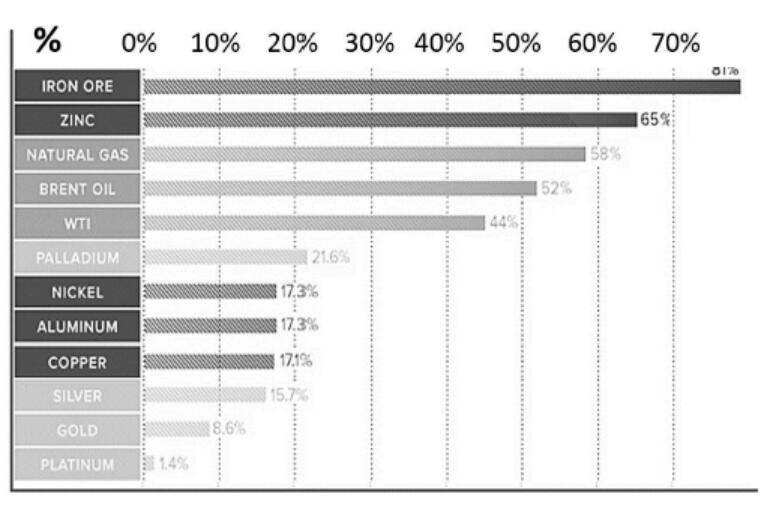
Meanwhile commodity prices were rising, with gold leading the way. The precious yellow metal traded to more than 1,380 USD in the wake of Britain’s Brexit vote, and silver shot up above 21 USD. Crude oil rose from just above 26 USD per barrel in February to more than 50 USD at the beginning of October. The price of sugar increased from 10 US cents per pound in August 2015 to more than 24 US cents on September 29, 2016. The prices of iron ore, zinc, tin, nickel, and lead all posted double-digit gains in 2016. In perhaps the most optimistic signal for commodity markets, the Baltic Dry Index rose from 290 in February to 915 in early October, an increase of more than 215 percent.
Crude oil prices doubled from their lows in 2009, and commodities started to shine again.
It appeared that prices for raw materials had reached a significant bottom. Commodities as an asset class posted impressive gains, rising by more than 20 percent from its lows in 2016 to the end of the year. WTI more than doubled in that period to above 55 USD/barrel.
Production cuts that had been in place since the start of 2017 helped halve the excess of global oil stocks, although, according to OPEC, those remained above the five-year average, at 140 million barrels. It was not until May 2018 that OPEC said the global oil supply surplus had nearly been eliminated.
Key Takeaways
•“Super-contango” had caused a massive supply glut in crude oil, during which storage facilities for WTI in Cushing, Oklahoma, reached maximum capacity: The world seemed to be floating in oil, and WTI crashed from almost 110 USD to less than 26 USD in February 2016—a drop of 76 percent and the lowest level for crude oil prices since 2003.
•During 2016, the Chinese domestic stock market plunged, and many other equity indices around the world followed, leading commodity markets lower as well. However, in spring 2016, commodity markets found a bottom, and commodities as an asset class posted impressive gains over the full year, rising by more than 20 percent. The price of WTI more than doubled in that period to more than 55 USD/barrel.
•Nevertheless, it would take until May 2018 until OPEC confirmed that the global oil supply surplus had nearly been eliminated.
41 Electrification: The Evolution of Battery Metals 2017
Elon Musk and Tesla are setting the pace for a mega trend: electrification! Demand from automobile manufacturers, utilities, and consumers pushes lithium-based battery usage to new heights. For commodity markets, it is not only lithium and cobalt but also traditional metals like copper and nickel that are suddenly in high demand again. Electrification might prove to be the “new China” for commodity markets in the long term.
“Tesla is here to stay and keep fighting for the electric car revolution.” —Elon Musk
The year 2016 issued a wake-up call for the automotive and oil industries. OPEC, the mighty oil cartel, massively revised its growth expectations for electric vehicles (EVs) upward by 500 percent. Instead of the 46 million EVs by 2040 it had envisioned in 2015, OPEC was now looking at a forecast of 266 million EVs.
If those projections turn out to be correct, by 2040 demand for oil could fall by 8 million barrels a day. That is about what the United States currently produces in a day, or roughly 8 percent of global consumption. (The world consumes almost 100 million barrels of crude oil every day, of which 75 percent is related to the transportation sector.)
Elon Musk and Tesla
Elon Musk, founder and CEO of SpaceX, Tesla, and Neuralink, was born in Pretoria, South Africa, in 1971. As of February 2018, Musk had a net worth in excess of 20 billion USD and was listed by Forbes as the 53rd-richest person in the world. In December 2016, he was ranked 21st on the Forbes list of “The World’s Most Powerful People.” Musk also founded PayPal, which was bought by eBay for 1.5 billion USD in October 2002.
Tesla, based in Palo Alto, California, specializes in electric vehicles (EVs), lithium-ion battery energy storage, and solar-panel manufacturing through its subsidiary company SolarCity. Tesla operates multiple production and assembly plants near Reno, Nevada, while its main vehicle-manufacturing facility is in Fremont, California. The Gigafactory in Reno primarily produces batteries and battery packs for Tesla vehicles and energy storage products. According to Bloomberg, over the past 12 months Tesla has been burning money at a clip of about 8,000 USD a minute (roughly 500,000 USD an hour).
In 2017 Tesla produced and sold 100,000 cars. It might be the beginning of a revolution, but so far EVs are hardly making a dent. German automakers BMW, Mercedes, and Audi together sold 6.6 million cars, and for these traditional car companies, the electric catchup has just started. In Germany, new car registrations of EVs reached 55,000, half of which were plug-in hybrids. This represented 1.6 percent of the new car market, based on 3.4 million new cars in Germany. Compared to 43.8 million total cars in use in that country, it was basically a grain of sand in the desert.
EVs made up 1.6 percent of new car registrations in car-crazy Germany in 2017. However, Bloomberg New Energy Finance estimates that by 2040, EVs will make up to 40 percent of global new car registrations—tremendous growth!
Currently China makes up half of the global EV market, according to the International Energy Agency’s Global EV Outlook 2018. In 2017, China sold 579,000 EVs, a 72 percent increase compared to 2016. Meanwhile, the global stock of electric passenger cars exceeded 3 million last year.
But compared to the bigger picture, that’s merely a drop of water in the ocean, since according to BMI Research, the global car fleet can be estimated at around 1.2 billion cars. And global sales of passenger cars are forecast to exceed 81 million vehicles in 2018. Along with China, the United States is among the largest automobile markets worldwide, in terms of both production and sales.
Therefore, it is all about the future as automakers start to expand their business into the electric mobility sector. Bloomberg New Energy Finance (BNEF) estimates that by 2040, global EV penetration of new car registration could reach 35 to 40 percent.
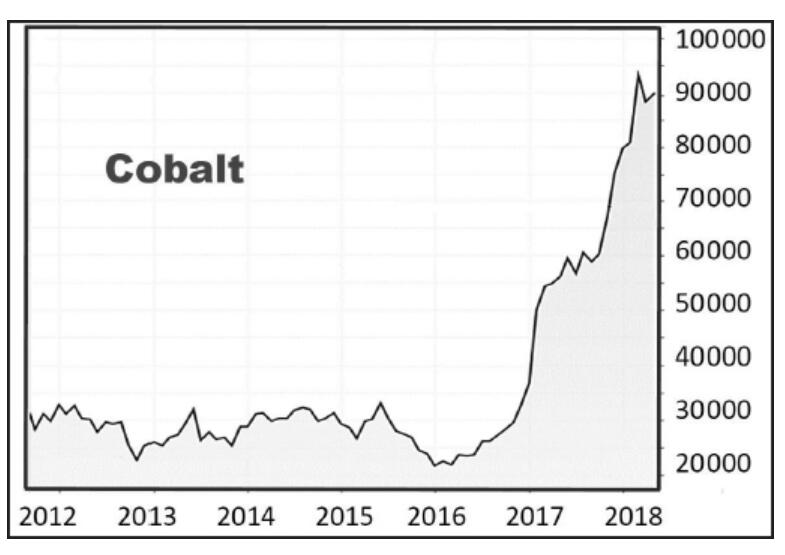
For commodity markets, this might signal the beginning of an avalanche, as electric cars demand additional raw materials. For example, studies done by the investment bank UBS and BNEF suggest that by 2040 there will be a significant surplus demand for graphite, nickel, aluminum, copper, lithium, cobalt, and manganese. Other commodities, like crude oil, steel, as well as platinum and palladium, would be negatively affected.
For commodity markets, the mega trend of electrification could turn out to be an enormous new source of demand.
Prices for cobalt and lithium, which are both essential for different types of batteries, are experiencing a bull market. Lithium-based batteries first had commercial applications a couple of years ago. Now we have them in almost all mobile devices: laptops, smartphones, electric tools, and cars. Gigafactories have been ramped up in the United States and China, and battery prices are falling because of economics of scale and scope. That, in turn, triggers new applications.
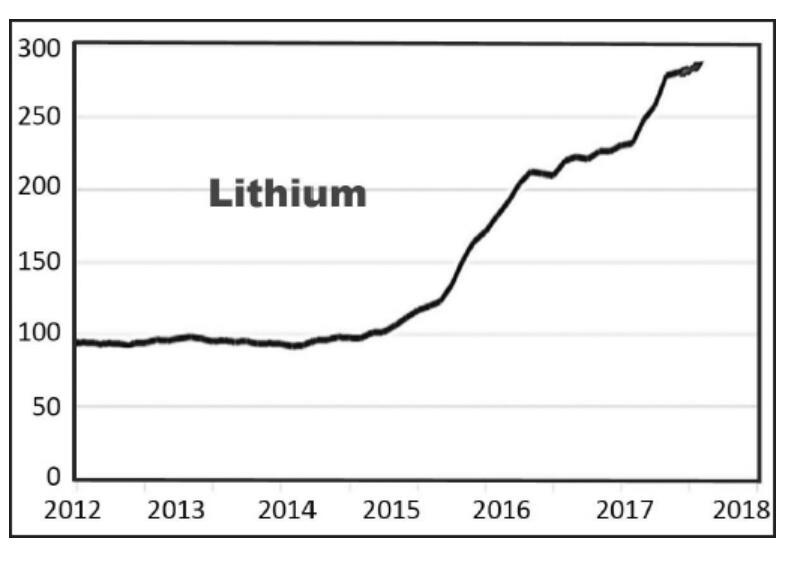
Tesla might lose its leadership in electric cars, but Elon Musk kicked off a revolution in electrification and energy usage—a revolution that works to the good of humanity and, as a side benefit, will be good for commodity markets as well.
The electrification of the automobile industry is a gigantic step, but only the tip of an iceberg. The ability to store energy is the missing link in growing alternative (wind, solar, and water) energy production. By 2025, power banks and power walls—instruments for decentralized energy storage at home, for example—might exceed sales for lithium-based batteries for the car industry. And this market is much bigger and promises much higher growth!
Key Takeaways
•There is a bull market for battery metals like lithium and cobalt, as battery-producing facilities shoot up like mushrooms. Prices for cobalt quadrupled from 25,000 to 100,000 USD per ton in 2017.
•Elon Musk and Tesla are at the forefront of a mega trend in electrification. Although sales of electric vehicles today are minuscule, industry estimates peg them at 40 percent of global new car registrations by 2040. We might be witnessing the beginning of a revolution.
•E-mobility is the first step, but energy storage is the missing link to alternative energy production by wind, sun, and water.
•Together, e-mobility and energy storage might prove to be the “new China” for commodity markets in the long term, since demand is climbing not only for lithium and cobalt, but also for traditional metals like copper and nickel.
42 Crypto Craze: Bitcoins and the Emergence of Cryptocurrencies 2018
Bitcoins, the first modern cryptocurrency, emerged in 2009, described in a white paper the previous year by the pseudonymous Satoshi Nakamoto. The value of bitcoins explodes in 2017 from below 1,000 to above 20,000 USD, attracting worldwide attention. This stellar price rise, followed by a crash of almost 80 percent in 2018, makes bitcoins the biggest financial bubble in history, dwarfing even the Dutch tulip mania of the 17th century. Despite the boom and bust, the future looks bright, as underlying blockchain technology reveals its potential and starts to revolutionize daily life.
“[Bitcoin/Blockchain] is the next major IT revolution that is about to happen.” —Steve “Woz” Wozniak, co-founder of Apple
“With all of the calls of ‘bubble,’ it’s worth remembering that we’re in the early stages of global adoption as well as the early stages of development of the technology.” —Ari Paul, Forbes
The punch came fast. Before boarding a flight to leave the country on April 1, 2018, Robert Farkas, co-founder of Centra Tech, was arrested by local criminal authorities in the United States. Half a year earlier, in September 2017, celebrity boxer Floyd Mayweather had posted happy pictures of himself living la dolce vita, spending money in expensive shops in Beverly Hills with his cryptocurrency-based Centra card.
Farkas and his Centra Tech co-founder Sohrab “Sam” Sharma had claimed to offer a debit card, backed by Visa and Mastercard, that would allow people to convert cryptocurrency to US dollars to spend on everyday goods. The Securities and Exchange Commission alleged that Centra had no relationship with either card company. Sharma and Farkas had created fake biographies of fictional executives and paid celebrities to tout the upcoming initial coin offering (ICO)—an unregulated process by which a company can issue a new digital coin in exchange for real money—and the promise of quick riches on social media. Sharma and Farkas had swindled about 32 million USD from investors.
Centra Tech is just one example of multiple scams and frauds in the crypto and ICO market in 2018, but it was dwarfed by other ICO scams like Modern Tech, which had made off with more than 660 million USD.
It is still pioneer days in the technology sector, where ICOs are more popular and better known than companies’ traditional initial public offerings (IPOs). ICOs have quickly become a more important source of project funding than endless discussions with venture capital companies. There’s a dark side, however. The opportunities of a fast-developing market always attract fraud and black sheep. That is part of the game.
The bitcoin was born in 2009. Today, more than 2,000 alternative coins exist.
December 2018 is still the Wild West in an industry that is barely 10 years old. Bitcoins (BTC), described in a white paper in November 2008 and first released as open-source software in January 2009 by the pseudonymous Satoshi Nakamoto, are generally considered the first decentralized cryptocurrency. It was originally created as an alternative, decentralized payment method. Since then, more than 2,000 alternative coin variants have been created. Like Napster 10 years earlier, the system works without a central bank, as a peer-to-peer network in which transactions take place directly between users, without an intermediary. Blockchain is the technology behind cryptocurrencies, and it is fast becoming a platform for a vast number of innovations in peer-to-peer transactions.
A blockchain is a cryptographically protected distributed ledger. It’s what protects you or anyone else from making a copy of that bitcoin you just bought. In fact, anything that you can make a mental list of, you can manage with blockchains—everything from tracking land and real estate ownership to the way we distribute medicine and how we grant certificates and diplomas. Some of these ideas are brilliant, while others are ridiculous.
Digital Assets, Cryptocurrencies, and Tokens
A digital asset is anything that exists in a binary format and comes with the right to use it, while the term “cryptocurrency” refers to coins that fulfill the characteristics of standard paper-based money (fiat money). The characteristics are its function as a store of value, a unit of account, and fungibility. Examples include bitcoin, ethereum’s ether, and ripple’s XRP. Note that ethereum and ripple refer to the underlying blockchain and not to their cryptocurrencies. Crypto tokens are similar to cryptocurrencies in that they are built on blockchains.
Cryptocurrencies are the most common form of tokens, but crypto tokens are broader representations of a blockchain’s value. That value is manifested across a diverse range—from cryptocurrencies to loyalty points and even to assets built on the blockchain.
Ethereum, for example, is the underlying blockchain for several tokens that use its platform to develop services and products. The difference between cryptocurrencies and crypto tokens becomes important within the context of investment. For example, cryptocurrency valuation is derived from a coin’s success in adhering to the characteristics of money. On the other hand, crypto token valuations depend on a different set of factors, such as protocol adoption and robustness.
Originally, cryptocurrencies were designed to offer a decentralized alternative to traditional fiat currencies. Even at peak valuation in December 2017, bitcoins—plus the sum of all other cryptocurrencies a decade after their invention—represented just a fraction of physical money in US dollars, euros, pound sterling, or yen in terms of value. In volume, bitcoins are still by far the biggest cryptocurrency, followed by ether, ripple, and dash. In 2018, the 500 biggest coins had a combined market capitalization of 500 billion USD, of which bitcoins made up two-thirds. Physical US dollar notes in circulation are valued at 1.5 trillion USD, and that is only a minor fraction of the total US dollar supply. Next in line is physical gold, whose circulating value is estimated at 8 trillion USD, before taking the whole currency market into consideration. All fiat currencies together add up to a value of 83 trillion USD, which includes all physical money in circulation and electronic, that is, virtual money.
Another important factor is the concentration of holdings. About 40 percent of bitcoins are held by perhaps 1,000 users. The top 100 bitcoin addresses control 17.3 percent of all the issued currency, according to Alex Sunnarborg, co-founder of the crypto hedge fund Tetras Capital. That’s important, since the cryptocurrency was designed to reach a maximum of 21 million bitcoins. Bitcoins are added by “mining,” a process by which transactions are verified and added to the public ledger. Currently, one bitcoin is added approximately every 10 minutes. With ether, the top 100 addresses control 40 percent of the supply, and with smaller currencies top coin holders control more than 90 percent because many of them are members of the teams running these projects.
Bitcoins were first explained to the public as a form of digital money, and that is how its successors and competitors like litecoin and ether have been framed as well. Each of these currencies resembles traditional money in certain ways: They are abstractions of economic value and can be traded. But none of them offers the most basic role of a currency as a relatively stable medium of exchange. There is too much friction involved. Each transaction takes too long, uses too much energy, and involves too many risks.
Bitcoins are more than digital money.
The biggest problems with bitcoins have emerged because the mechanics of buying and holding them are so inscrutable that nearly everyone pays third parties to handle them. Those wallet-service middlemen become points of failure for the whole system. They get hacked, their systems go down, and they are ordered by governments and regulators to report transactions that users thought would be anonymous.
The Mt. Gox Heist
Launched in 2010 by Jed McCaleb, who later founded ripple, Mt. Gox, by 2013, had become the largest bitcoin exchange in the world. Based in Shibuya, an area in Tokyo, Japan, at that point Mt. Gox was handling more than 70 percent of all bitcoin transactions worldwide. In June 2011, when Mt. Gox was acquired by Mark Karpelès, the company was hacked the first time, and 2,000 bitcoins were stolen. As a consequence, a number of security measures were initiated, including arranging for a substantial number of bitcoins to be taken offline and held in cold storage. As a result of an investigation by the US Department of Homeland Security regarding the company’s license, the US government seized more than 5 million USD from Mt. Gox, and the company had to announce a temporary suspension of US dollar withdrawals. But that was not the biggest problem. As it turned out, the company had been the victim of an ongoing hack for more than two years.
In February 2014, Mt. Gox suspended trading, closed its website and exchange service, filed for bankruptcy protection in Japan and the United States, and began liquidation proceedings soon after. The crypto exchange announced that approximately 850,000 bitcoins belonging to customers and the company were missing (valued today at 4.2 billion USD). Although 200,000 bitcoins were eventually recovered, the remaining 650,000 have never been found.
CEO Mark Karpelès was arrested in August 2015 in Japan and charged with fraud and embezzlement and manipulating the Mt. Gox computer system to increase the balance in an account. US authorities followed the trail of money, and in July 2017 Alexander Vinnik was arrested in Greece and charged with playing a key role in the laundering of bitcoins stolen from Mt. Gox. Vinnik is alleged to be associated with BTC-e, an established bitcoin exchange, which was raided by the FBI as part of the investigation. The BTC-e site has been shut down, and the domain has been seized by the FBI. But no money has been found so far.
What is a fair price for a bitcoin? Is it 1 or 100,000 USD? Some financial analysts today emphasize that bitcoins have no intrinsic value at all, and some economists refer to the Fisher equation, which pins the current value of a bitcoin to 20 to 25 USD in regard to the total available number of bitcoins, transaction speed, and trading volume. But it’s important to note that for this equation it is not the status quo but the future potential of the technology and application that is relevant for a bitcoin’s value. And it is hard to see limits to the application of blockchain technology.
In May 2010 Laszlo Hanyecz bought two pizzas in Jacksonville, Florida, for 10,000 BTC. It was the first real-world bitcoin transaction.
Bitcoins became a hot topic in 2017 in the financial mainstream because of tremendous price fluctuations. Let’s take a step back: Prices initially were measured in US cents and single-digit US dollars in the land of Dungeons and Dragons or World of Warcraft. But on May 22, 2010, Laszlo Hanyecz made the first real-world bitcoin transaction by buying two pizzas in Jacksonville, Florida, for 10,000 BTC, valuing one bitcoin at 0.003 USD. One year later, in spring 2011, bitcoins were traded at parity with US dollars. And six years after that, on December 17, 2017, bitcoins surpassed 20,000 USD for the first time.
Bitcoins traded at 0.03 USD in May 2010 and above 20,000 USD in December 2017.
That same month, in December 2017, the Chicago Mercantile Exchange (CME) introduced and listed futures contracts on bitcoins in the commodity segment, allowing a hot speculative bubble to unfold. Bitcoins became commoditized and open to new investors and the mainstream, beyond the niche of electronic wallets. Until then, bitcoin and other cryptocurrency trading had been limited to specialized exchanges like Bitfinex, Kraken, or OKCoin, where you had to exchange US dollars or euros into bitcoins with your electronic wallet, though bitcoins were exchangeable into any other cryptocurrency. From its high in December, bitcoins crashed to below 6,000 USD within two weeks.
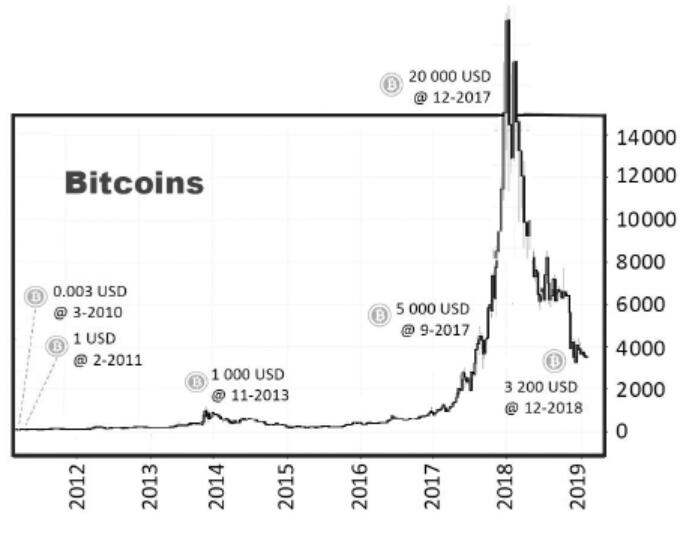
In December 2018, bitcoins tumbled below 3,500 USD to a 13-month low before stabilizing. The slide fueled a sell-off among rival tokens ether, litecoin, and XRP. After months of stability at around 6,000 to 6,500 USD, bitcoins and other cryptocurrencies had lost more than 700 billion USD in market capitalization since their peak in December 2017.
Regulatory concerns played a role, as the US Securities and Exchange Commission announced penalties against two companies that hadn’t registered their initial coin offerings as securities. Also, the US Justice Department was in the process of investigating whether the previous year’s rally was fueled by market manipulation.
As Robert Shiller noted in his book Irrational Exuberance, it is impossible to spot a bubble and time its burst if you are part of it. That is possible only in hindsight. But after the stellar rise from less than 1 USD before 2011 and the crash by almost 80 percent from its December 2017 peak, the verdict is official: The bitcoin craze is the biggest financial bubble in history! It even dwarfs the tulip mania of the 17th century, which had previously exceeded every historic financial market bubble, including the Mississippi or South Sea Bubble, the run-up in equity prices before the busts of the Great Depression and Black Friday, or—more recently—the dot-com bubble and the rally before the world financial crisis hit in 2008.
It may comfort investors that an 80 percent crash is not a unique event in the crypto space. In the past five years, the value of bitcoins was cut in half three times, and crashed by more than 25 percent 16 times, only to rise to new highs until 2018. Think back . . . how many years did it take to recover your losses from the dot-com bubble? Measured by the NASDAQ Composite, on average that took about 15 years! In the past, recoveries in the crypto universe have been much faster.
The year 2013 was a rough ride for bitcoins. And the Mt. Gox heist almost became an extinction event for the cryptocurrency.
In percentage terms, the bitcoin crashes of 2013 were almost as bloody as 2018. Prices ran up from a couple of US dollars to more than 1,200 USD, before plummeting. In April 2013, bitcoin prices fell from 230 to 67 USD overnight, a massive 70 percent drop in 12 hours. It took seven months to recover. After April, bitcoin prices hovered around 100 to 120 USD until later in the year, when prices suddenly skyrocketed to 1,200 USD in late November. However, in December the price tumbled back to less than half of that.
Adding to the long road of recovery after the collapse in December 2013 was the Mt. Gox scandal. Bitcoins steadily increased in price through January and February, when they suddenly dropped by nearly 50 percent from 880 to below 500 USD because of the Mt. Gox heist.
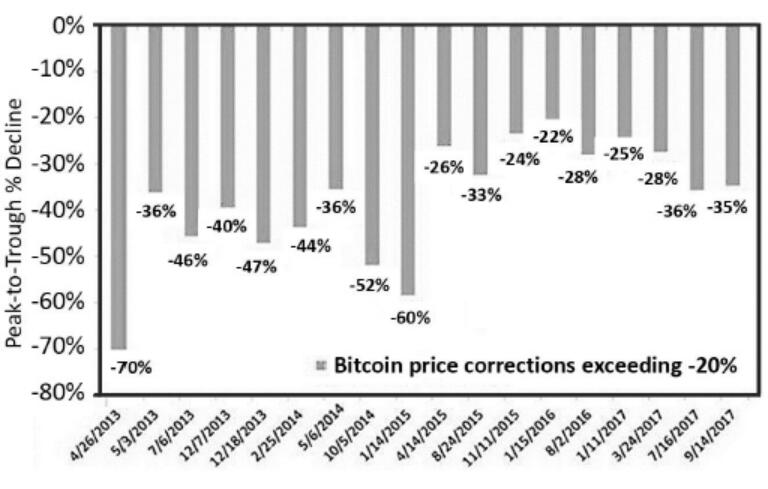
One of the results of the erratic price swings of 2013–2014 is the emergence of an active cryptocurrency trading scene with its own slang, a special language established by crypto enthusiasts. The term “HODL” is probably the best known. During a massive price crash in 2013, someone called “GameKyuubi,” apparently drunk, posted “I AM HODLING” in a Bitcoin Talk forum. What the user in the post wanted to convey was the fact that despite the sharp drop in price, he was choosing to hold on to his bitcoins. The post went viral, and #HODL has been interpreted as “Hold On for Dear Life,” which corresponds to “Buy & Hold,” an investment strategy every long-term investor can relate to.
#HODL. Hold On for Dear Life.
Crypto slang today is very colorful, with a multitude of new terms and phrases whose meanings go way beyond their traditional definitions. There are words and abbreviations such as “mooning,” “fudding,” ADDY, JOMO, BTFD, and DYOR—the list goes on and on. HODL, however, is by far the most popular of these terms, and one that almost all cryptocurrency investors can identify with.
Anti-money-laundering measures and the Chinese ban on cryptocurrencies and ICOs weighed heavily on bitcoins in 2018.
How does one account for the extraordinary bitcoin rally and its bust? Originally, bitcoins were founded to redistribute value and move money away from banks and other financial institutions to people. Anyone could become a bank, a payment service, or a lender. But bitcoins and other cryptocurrencies also became a loophole for money laundering and capital flight. Because of the low level of legal regulation, the use of cryptocurrency spread into the shadow economy. The implementation of an automatic exchange of information in 2017 led to last-minute panic as a new global standard on the automatic exchange of information targeted tax evaders. The new system provides for the exchange of non-resident financial account information with the tax authorities in the account holders’ country of residence. Data was exchanged for the first time in September 2017, but the majority of the 100-plus jurisdictions had implemented the system by January 1, 2018.
The Top 5 Crypto Billionaires in 2018
1.Chris Larsen (57), co-founder of ripple, owns 5.2 billion XRP, the token launched by ripple, whose current value is 8 billion USD.
2.Joseph Lubin (53), co-founder of ethereum, has an estimated wealth of 1–5 billion USD.
3.Changpeng Zhao (41), founder and CEO of Binance, the world’s largest cryptocurrency exchange, has an estimated wealth of 1–2 billion USD.
4.Cameron and Tyler Winklevoss (36) were early investors in bitcoins and the founders of Gemini in 2015. Their estimated wealth is 0.9–1.1 billion USD.
5.Matthew Mellon (45), an early investor in ripple’s XRP, has an estimated wealth of 0.9–1 billion USD.
Source: Business Insider, 2018.
Capital flight has also worried the government of China. By buying bitcoins, the Chinese have been able to move funds abroad. In September 2017, renminbi-to-bitcoin trades made up more than 90 percent of all bitcoin transactions. The government outlawed fiat money from being used in cryptocurrency purchases and even imposed travel bans on Huobi and OKCoin executives, two of the nation’s largest crypto exchanges. Chinese regulatory authorities also imposed a ban on ICOs and finally termed them illegal in China in September 2017. Huobi was forced to move its operations to Singapore, while OKCoin, renamed OKEx, was embraced by Malta. Many Chinese simply transferred their bitcoins to the now-offshore exchanges and carried on trading—until February 2018.
That February, the People’s Bank of China (PBOC), which is the central regulatory authority, issued a statement that “it will block access to all domestic and foreign cryptocurrency exchanges and ICO websites,” basically shutting down all cryptocurrency activities in the country. And the authorities were not bluffing: In April 2018, police stormed a large-scale bitcoin mining operation in the city of Tianjin and confiscated 600 computers in the raid
For bitcoins and blockchains, 2018 was like 1992 for the internet—early days. To reveal the cryptocurrency’s full potential, another 10 years are needed.
The Chinese government has been successful in imposing stricter capital controls, banning bitcoin trading and ICOs, and shielding its people from bad influences by its Great Firewall. But China will not be able to turn back time for blockchain technology and its applications.
The blockchains and cryptocurrencies will achieve their full potential in a decade, said Steve Wozniak, co-founder of Apple, in 2018, and according to Jack Dorsey, CEO of Twitter, bitcoins will become the world’s “single currency.” Previously, from 2014 to 2017, Jamie Dimon, CEO of JPMorgan Chase, was regularly quoted about his views of bitcoins: “Bitcoin is a fraud,” he said, as well as “Bitcoin will not survive,” and “Bitcoin is going nowhere.” In 2018, Jamie Dimon regretted that he had called bitcoin a fraud but still remained bearish. Meanwhile, earlier in that year, overwhelmed by client demand, JPMorgan Chase’s top rival, Goldman Sachs, announced the setup of a cryptocurrency trading desk.
As for a distributed ledger technology like blockchain, its situation today is like that of the internet in 1992, with immense potential but a steep and messy learning curve. Every successful new technology undergoes an explosion of growth in which we try to use it for everything, until time reveals what the best applications and limitations are. Investing in dot-com stocks in the late 1990s was a roller-coaster ride, and many of the pioneers in that field ultimately failed. The real impact of the internet has taken decades to unfold, but the future of e-commerce and society has been changed forever.
Blockchain technology has the potential to be just as impactful over time. Just as with the dot-com bubble, backing any single player in the crypto craze is like placing a bet on 27 red in a game of roulette. It is too early and the outcomes are too uncertain to identify potential winners. However, with the digital revolution we are experiencing right now, the economic landscape will be transformed in drastic ways. And, despite its sins of adolescence and the irrational exuberance of crypto trading’s early years, crypto tokens and blockchain technology have already begun to revolutionize our world. The applications in real estate, property, banking and financial services, and health care, just to name a few, are limitless and can only be compared with the development of the internet or the rise of smartphone applications. It might be that we are witnessing the first glimpse of a tokenized and coin-based economy. The future looks bright.
Key Takeaways
•Bitcoins were introduced in 2009 as an alternative, decentralized payment method using blockchain technology. Today more than 2,000 alternative coins (“altcoins”) exist.
•Over 10 years the price of bitcoins rose from 0.003 USD in 2010 to 1 USD in 2011, to more than 1,000 USD in 2017. It exceeded 20,000 USD in December 2017, but within weeks, bitcoins dropped by almost 80 percent to below 3,500 USD in December 2018.
•This tremendous boom and bust has made bitcoins the biggest financial bubble in history, greater even than the Dutch tulip mania of 1637.
•The boom and bust of 2017–2018 has been associated with the Chinese ban on cryptocurrencies and ICOs, as well as anti-money-laundering measures like the implementation of automatic exchange of financial information in more than 100 countries. The beginnings of new disruptive technologies often attract black sheep and fraud, and many of the ICOs did turn out to be scams.
•For bitcoins and blockchain applications, it is still early days. To reveal their true potential, another decade is needed. But from today’s perspective, the applications seem limitless.
Outlook: The Dawn of a New Cycle and a New Era
We are at the dawn of the 2020s and the commodity and crypto markets are in the starting blocks for a new rally. At the beginning of 2016, commodity investors looked back on five painful bear market years. In 2015, the Bloomberg Commodity Index, which measures the performance of 22 commodities like crude oil, gold, copper, wheat, and corn, lost 25 percent of value. And it got worse: In January 2016, commodity markets traded down an additional 7 percent. The Bloomberg Commodity Index was trading at its lowest level since its inception in 1991. Since spring 2014, investors had lost almost half of their invested funds. Investors in gold and silver mining companies, in particular, were hit hardest. The Arca Gold BUGS Index and Philadelphia Gold and Silver Index, both representing the biggest gold and silver mines, traded down to levels last reached at the beginning of 2000, when a troy ounce of gold was 260 USD.
From summer 2011 to the beginning of 2016, investors saw 80 percent of their principal vanish into thin air, while gold in the same period traded down from above 1,900 USD to 1,050 USD (–45 percent). Mining in general suffered greatly. Market capitalization of companies included in the MSCI World Metals & Mining Index dropped by more than 80 percent since their peak valuation during the commodity super cycle in 2008. Shares of Glencore, the biggest mining and commodity trading company in the world, traded down to 67 GBP at the end of September 2015. From its highest prices in 2011, investors lost more than 80 percent of their capital. Compared to its closing price of 527 GBP for its initial public offering in May 2011, this represented a loss of shareholder value of almost 90 percent!
Market exaggerations drove credit default swaps for mining companies into the stratosphere. For example, Glencore’s 2.5 percent yielding bond, maturing in 2019, dropped by 25 percent within three months to 75 US cents per dollar, offering a yield to maturity of more than 17 percent per year for investors. The same held true, for example, for bonds of Freeport-McMoRan, Teck Resources, First Quantum, or Lundin Mining, all large cap mining companies. Investors anticipated the bankruptcy of a whole industry.

.In retrospect, we witnessed capitulation levels at the beginning of the year 2016. However, bold investors were able to make a killing in commodities during an early recovery. Compared to January 2016, gold mines tripled in value in just half of a year while gold gained 30 percent. Shares of Glencore approached 300 GBP, quadrupling in value compared to its lows just a couple of months before.
While commodity markets crumbled and value in mining evaporated, world equity and bond markets celebrated the time of their life. MSCI World increased steadily after its drop by almost 60 percent during the financial crisis of 2008–2009. In the United States, the Dow Jones and S&P 500 were both trading at all-time highs in late 2016 and continued their path of success until January 2018. At the same time, yields of 10-year bonds in the United States fell below 1.5 percent, while in Europe, German 10-year bonds dropped into negative territory. Bond investors woke up every day believing their party would never stop.
Looking at the long-term relationship between equities and commodities by taking the ratio of S&P Goldman Sachs Commodity Index versus the S&P 500, one fact is striking: Relative valuation is extreme. Compared to equities, commodities have been stuck in the penalty box since the China-fueled commodity super cycle burst. Similar to the tech bubble 15 years ago, Alphabet (Google) today is valued equal to the aggregated market capitalization of all companies included in MSCI World Metals & Mining Index (more than 180 companies, including mining giants like BHP Group, Rio Tinto, Glencore, Vale, Barrick Gold, and Newmont Mining)! One has to ask: What is cheap, and what is expensive?
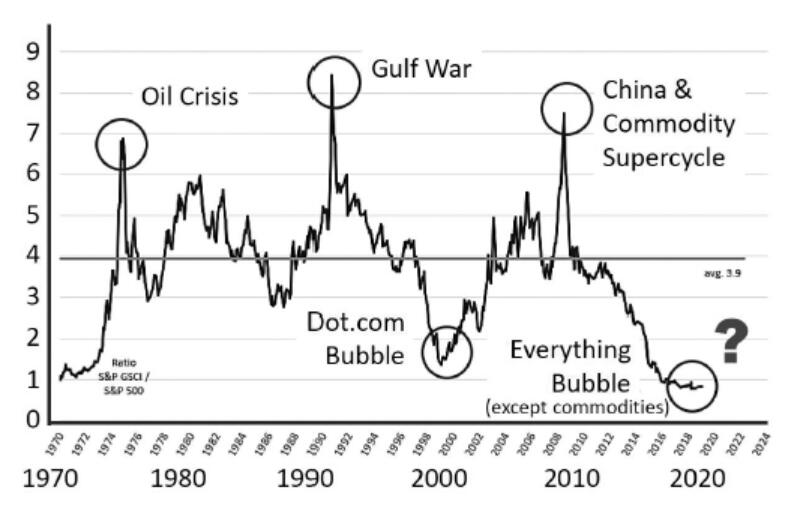
Therefore, it is no surprise that after a severe five-year bear market, a 15 percent rise in commodity markets in 2016 passed the majority of investors unnoticed. From their intra-year lows, commodity market indices like the Bloomberg Commodity Index (BCOM), S&P Goldman Sachs Commodity Index (S&P GSCI), and Rogers International Commodity Index (RICI) all gained more than 25 percent and surpassed equity-index performance. Furthermore, metals and mining as well as oil and gas led the equity-index sector performance in the United States and Europe, but fund manager surveys show that investors continued to be massively underweighted in resources equities.
Recent history aside, investors can refer to several commodity markets that are still in oversupply. But in terms of supply-demand imbalances following the boom of the commodity super cycle, the worst is behind us. Slashes of industry investments in mining, as well as in oil and gas, will have brutal results in 2020–2030, when natural depletion will combine with and outweigh reduced exploration and development expenditures. With fundamental market data for commodities just starting to improve, commodity prices reached a technical bottom. A shift of the 200-day moving average to the upside in April 2016 was a first positive sign for a bullish market environment in commodities in the future.
In conclusion, 2016 might prove to have been the dawn of a new cycle for commodity investors, a multiyear period of rising prices, which also reflects healthy prospects for the global mining industry. In the coming years, new trends like battery metals for electrification, e-mobility, and the megatrend of digitalization, which includes cryptocurrencies, will become an important and enormous driver for productivity, growth, and commodity markets. Electric vehicles might not need gasoline or diesel, but demand for gold, copper, nickel, cobalt, lithium, and rare earths increases drastically. If this scenario holds true, we witnessed the beginning of a new cycle which can only be compared to the awakening of the Chinese economy almost 20 years ago. It is also the beginning of a more mature stage in blockchain and bitcoins, as the exuberance of the early years is gone and opens the path to future applications.
Epilogue
“Commodities tend to zig when the equity markets zag.” —Jim Rogers, commodity expert and co-founder of the Quantum Fund
Let us take a short time trip back to the year 2001. The average price for a barrel of crude oil was 26 USD. In the course of the year, the price of a ton of copper dropped from 1,800 to below 1,400 USD. Gold traded between 255 and 293 USD per troy ounce and made its first serious attempt in modern times to jump above 300 USD.
Prices for wheat and corn averaged 2.70 and 2.08 USD per bushel. The terror attacks of 9/11 on the World Trade Center and the Pentagon, which killed about 3,000 people, were the most traumatizing events in 2001. Although the head of Al-Qaeda, Osama bin Laden, was shot in an elite U.S military mission in 2011, the war against global terrorism still has not been won today, almost 20 years later. But at least a military victory against the Islamic State seems imminent. In the White House, Democrat Bill Clinton was replaced by Republican George W. Bush; 15 years later Republican Donald Trump took over the presidency from charismatic Democrat Barack Obama. Cynical observers note that 9/11 has been replaced by 11/9, the date Donald Trump’s election was announced.
In 2001, commodities as a professionally recognized and investable asset class were still in their infancy. The Bloomberg Commodity Index, as a measure of commodity market performance, had been launched just a few years earlier, in 1998, as the Dow Jones AIG Commodity Index. Alternative investments in addition to traditional investments in equities and bonds have since become more fashionable, thanks to the investment strategies of endowment funds such as those at Yale and Harvard Universities. In 2005, Gary Gorton and K. Geert Rouwenhorst published “Facts and Fantasies about Commodity Futures,” which also helped anchor commodities as an integral part of a global asset allocation.
At the end of 2001, China entered the World Trade Organization (WTO), an event that marked the beginning of rapid growth of the Chinese economy and caused massive turbulence for global commodity markets. Within a few years, China had evolved as a dominant factor in global commodity demand, and the commodity super cycle was born.
Crude oil reached 147 USD per barrel, copper traded above 10,000 USD per ton, gold surpassed 1,900 USD per troy ounce, and wheat and corn shot up to 9.50 and 8.40 USD per bushel. But depression followed euphoria in the form of years of sluggish growth in the aftermath of the global financial and economic crisis. The year 2008 was an annus horribilis for global capital markets, as equity and commodity markets dropped by more than 50 percent. A period of deleveraging and sluggish growth followed a nonsustainable recovery. Thereafter, commodity markets faced five years of a severe bear market.
Today, approaching 2020, we are witnessing the starting point of a new commodity bull market and a maturing of the market for cryptocurrencies. The exuberance of the commodity super cycle is gone, invested assets are rising again for the first time in years, and commodity market performance is up ahead of equities. The price of a barrel of oil tested a low of 26 USD during spring 2016 but has since nearly tripled from that level. Copper traded in excess of 6,000 USD per ton. Gold rose above 1,300 USD per troy ounce. In the agricultural sector, wheat and corn prices averaged 4.80 and 3.60 USD per bushel. From a technical perspective, bottom building was completed in 2016, as commodities went above their 200-day moving average and created a bullish chart pattern in 2017. Nevertheless, even at the start of 2019 the majority of commodities still traded way below their medium- to long-term average prices, and bitcoins are in a phase of bottom-building.
In hindsight, 2016 proved to be the turning point for commodities, as fundamentals started to improve, prices recovered, and the way was cleared for a new market cycle.
The 42 chapters of this book show, on the one hand, that commodity market speculation was not invented in this decade. On the contrary, in the 1980s and 1990s commodities had only disappeared from investors’ radar screens, while the 1970s also saw tremendous commodity price spikes. Many of the episodes described here—from the Dutch tulip mania in the 17th century to the fantastic rise and fall of bitcoins in the 21st century—show how dramatically temporary imbalances on the supply or demand side can affect individual commodity markets. The real economic consequences should not be underestimated, as unlike stocks, bonds, or currencies, commodities are real assets. Political unrest and failing governments because of high food prices in Africa, which led to the Arab Spring, or current instabilities in Venezuela and Brazil due to low oil prices, are only two examples.
Tulips and bitcoins are linked as the two biggest financial bubbles in history, despite nearly 400 years between them. Meanwhile markets and events have given rise to 40 fantastic stories from the commodity world. The wheel of time continues to turn, and due to the cyclical nature of commodity markets, extreme events are doomed to repeat themselves, albeit in a modified form. Each market is determined in its extreme phase by greed and fear; and the short memory of capital markets is proverbial anyway.
The episodes summarized in this book are meant to highlight the booms and busts of commodity and crypto markets. Besides extreme price fluctuations, this book aims to show an insider’s perspective on speculation, gains, and losses that determine individual fates. The extent and velocity of price spikes are stunning, even for long-term investors. Linking commodity market events over several hundred years demonstrates the parallels among events in the past and prepares us for future developments including blockchain and bitcoins.
Glossary of Terms
List of Abbreviations
List of Figures
| Figure 1. | Rice. Candlestick chart in USD/cwt 2016, Chicago Board of Trade (CBOT). Data: Bloomberg, 2019. |
| Figure 2. | Crude oil prices 1861–2018, in USD/barrel (real prices of 2015). Data: BP Statistical Review of Energy, 2019. |
| Figure 3. | Prices for soybean oil, 1960–1964, in US cents/lb, Chicago Board of Trade. Data: Bloomberg, 2019. |
| Figure 4. | Wheat prices, 1970–1977, in US cents/bushel, Chicago Board of Trade. Data: Bloomberg, 2019. |
| Figure 5. | Gold-silver ratio, 1973–2013. Data: Bloomberg, 2019. |
| Figure 6. | Crude oil prices, 1965–1986, in USD/barrel. Data: Datastream, 2019. |
| Figure 7. | Diamond prices, 2003–2016. Prices indexed over different sizes and qualities. Data: PolishedPrices.com, Bloomberg, 2019. |
| Figure 8. | Silver prices, 1970–1982, in USD/troy ounce. Data: Bloomberg, 2019. |
| Figure 9. | Crude oil prices, 1989–1991, in USD/barrel. Data: Bloomberg, 2019. |
| Figure 10. | Crude oil future term structure in 1993/1994, in USD/barrel. Data: Bloomberg, 2019. |
| Figure 11. | Silver prices, 1994–2008, in USD/troy ounce. Data: Bloomberg, 2019. |
| Figure 12. | Silver, Pan American Silver, and Apex Silver, 1998–2009. Performance indexed 1998. Data: Bloomberg, 2019. |
| Figure 13. | Copper in US cents/lb, 1995–1997. Data: Bloomberg, 2019. |
| Figure 14. | Share price of Bre-X, 1992–1997, in Canadian dollars (CAD). Data: Bloomberg, 2019. |
| Figure 15. | Palladium in USD/ounce, 1998–2004. Data: Bloomberg, 2019. |
| Figure 16. | Copper prices in USD/ton, 2003–2007, London Metal Exchange (LME). Data: Bloomberg, 2019. |
| Figure 17. | Zinc prices in USD/ton, 2003–2006, London Metal Exchange (LME). Data: Bloomberg, 2019. |
| Figure 18. | Natural gas prices in USD/MMBtu, 2003–2007, New York Mercantile Exchange. Data: Bloomberg, 2019. |
| Figure 19. | Price spread between natural gas March and April 2007 delivery, in USD/MMBtu, New York Mercantile Exchange. Data: Bloomberg, 2019. |
| Figure 20. | Future term structure of natural gas in USD/MMBtu, 2010, New York Mercantile Exchange. Data: Bloomberg, 2019. |
| Figure 21. | Frozen orange juice concentrate prices in US cents/lb, 2002–2006.Data: Bloomberg, 2019. |
| Figure 22. | Norwegian salmon prices in NOK/kg, 2000–2011. Data: Bloomberg, 2019. |
| Figure 23. | Steel prices in USD/ton, 2000–2010. Data: Bloomberg, 2019. |
| Figure 24. | Wheat prices in US cents/bushel, 2005–2008, Chicago Board of Trade. Data: Bloomberg, 2019. |
| Figure 25. | Natural gas prices in USD/MMBtu, 2003–2007, New York Mercantile Exchange. Data: Bloomberg, 2019. |
| Figure 26. | Platinum prices in USD/troy ounce, 2004–2009. Data: Bloomberg, 2019. |
| Figure 27. | Rice prices in US cents/cwt, 2000–2010, Chicago Board of Trade. Data: Bloomberg, 2019. |
| Figure 28. | Wheat prices in US cents/bushel, 2007–2008, Chicago Board of Trade. Data: Bloomberg, 2019. |
| Figure 29. | Crude oil (WTI) term structure in USD/barrel, 2008. Data: Bloomberg, 2019. |
| Figure 30. | Price spread of crude oil January (CLF9) and December 2009 (CLZ9) in USD/barrel. Data: Bloomberg, 2019. |
| Figure 31. | Baltic Dirty Tanker Index, 2002–2010. Data: Bloomberg, 2019. |
| Figure 32. | Sugar prices in US cents/lb, 1970–2010. Data: Bloomberg, 2019. |
| Figure 33. | Cocoa prices in USD/ton, 1990–2012. Data: Bloomberg, 2019. |
| Figure 34. | Copper and share price of First Quantum Minerals, 2009–2010. Data: Bloomberg, 2019. |
| Figure 35. | BP share price fluctuation during first half of 2010. Data: Bloomberg, 2019. |
| Figure 36. | Cotton prices in US cents/lb, 2005–2013. Data: Bloomberg, 2019. |
| Figure 37. | Glencore (GBP). Equity price performance since IPO on May 19, 2011. Data: Bloomberg, 2019. |
| Figure 38. | Rare earth carbonate, neodymium, dysprosium, and lanthanum, 2010–2013. Chinese onshore prices in RMB, indexed 30.12.2009=100. Data: Bloomberg, 2019. |
| Figure 39. | Crude oil (WTI): recovery and bear market, 2008–2016. Data: Bloomberg, 2019. |
| Figure 40. | Commodity performance in 2016. Data: Bloomberg, 2019. |
| Figure 41. | Cobalt prices, 2012–2018. Data: Bloomberg, 2019. |
| Figure 42. | Benchmark Lithium Index, 2012–2018. Data: Benchmark Mineral Intelligence, 2019. |
| Figure 43. | Price of bitcoins surpassed 1,000, 5,000, 10,000, and finally 20,000 per USD in 2017. Data: Bloomberg, 2019. |
| Figure 44. | Historic bitcoin price corrections, 2013–2017. Data: Coindesk.com. |
| Figure 45. | 50 years of commodity markets ups and downs. Did we see the beginning of a new bullish cycle in 2016? Data: Bloomberg, 2019. |
| Figure 46. | Relative valuation of commodities versus equities. Buy commodities! Data: Bloomberg, 2019. |
References
1.Tulip Mania: The Biggest Bubble in History (1637)
Dash, M. Tulpenwahn. Die verrückteste Spekulation der Geschichte. München: Claasen Verlag, 1999.
Friedmann, J. “Tulpen-Wahn in Holland—Wie die große Gartenhure Investoren verrückt machte.” www.spiegel.de, 1 August 2009.
von Petersdorff, W. “Eine Blumenzwiebel für 87.000 Euro.” www.faz.net, 18 March 2008.
2.The Dojima Rice Market and the “God of Markets” (1750)
Mattheis, P. “Der Reishändler.” SZ-Serie: Die großen Spekulanten 39. www.sueddeutsche.de, 28 October 2008.
Needham, J. “Samurai trader!” www.financialsense.com, 20 January 2008.
3.The California Gold Rush (1849)
Bojanowski, A. “Neuer Goldrausch in Kalifornien—‘Es ist wie 1849.’” www.sueddeutsche.de, 17 June 2008.
“Going to California—49ers and the Gold Rush.” http://americanhistory.about.com, 2008.
“Gold Rush.” The California State Library, www.library.ca.gov/goldrush, 2007.
4.Wheat: Old Hutch Makes a Killing (1866)
“B. P. Hutchinson dead—once leading grain speculator in this country.” The New York Times, 17 March 1899.
Ferris, W. G. The Grain Traders. The Story of the Chicago Board of Trade. East Lansing: Michigan State University Press, 1988.
Geisst, Charles. Wheels of fortune—The history of speculation to respectability. Hoboken, NJ: John Wiley & Sons, 2002.
“The great speculator fails—Mr. Hutchinson leaves Chicago and his trades closed out.” The New York Times, 30 April 1891.
Teweles, R. J., and Jones, F. J. The Futures Game—Who Wins? Who Loses? And Why? New York: McGraw-Hill, 1987.
5.Rockefeller and Standard Oil (1870)
King, B. W. “John D. Rockefeller und das Zeitalter des Öls.” http://finanzen.coart.de/BrsenKnowHow/Geschichtliches, 18 August 2006.
Kunz, M. “Reichster und meistgehasster Mann der Welt.” www.focus.de, 23 May 2008.
6.Wheat: The Great Chicago Fire (1872)
Ferris, W. G. The Grain Traders: The Story of the Chicago Board of Trade. East Lansing: Michigan State University Press, 1988.
Geisst, C. Wheels of fortune—The history of speculation to respectability. Hoboken, NJ: John Wiley & Sons, 2002.
“The wheat corner—sudden collapse of the grain gamblers’ schemes in Chicago loss of the clique over USD 1,000,000.” The New York Times, 23 August 1872.
7.Crude Oil: Ari Onassis’s Midas Touch (1956)
“Aristoteles Onassis—Reicher Mann ganz arm.” www.stern.de, 13 January 2006.
“Kalkuliertes Risiko.” Der Spiegel 29(1978), www.spiegel.de.
Seebach, W. “König Saud und Aristoteles Onassis.” Die Zeit, www.zeit.de, 17 June 1954.
8.Soybeans: Hide and Seek in New Jersey (1963)
Food and Agriculture Organization of the United Nations (FAO), www.fao.org, December 2008.
“The man who fooled everybody.” www.time.com, 4 June 1963.
Miller, N. C. The Great Salad Oil Swindle. Baltimore: Penguin Books, 1965.
“Wall Street: spreading the losses.” www.time.com, 6 December 1963.
9.Wheat: The Russian Bear Is Hungry (1972)
“Another Soviet grain sting.” www.time.com, 28 November 1977.
The Food and Agriculture Organization of the United Nations (FAO), www.fao. org, December 2008.
Mattheis, P. “Der Turtle-Chef.” SZ-Serie: Die großen Spekulanten (33), www.sueddeutsche.de, 29 January 2008.
Peters, M., Langley, S., and Westcott, P. “Agricultural commodity price spikes in the 1970s and 1990s.” United States Department of Agriculture (USDA), March 2009, www.ers.usda.gov.
10.The End of the Gold Standard (1973)
Schulte, T. “Silber—das bessere Gold.” Kopp Verlag, 2010.
“Die Silber-Panik” (1893). http://zeitenwende.ch.
“US-Bundesstaaten wollen einen Gold- und Silberstandard.” www.bullion-investor.net, 7 March 2010.
11.1970s—Oil Crisis! (1973 & 1979)
“Die Ölkrise 1973.” http://zeitenwende.ch, 2009.
Organization of the Petroleum Exporting Countries (OPEC), www.opec.org, 2008.
US Department of Energy, www.eia.doe.gov, 2008.
12.Diamonds: The Crash of the World’s Hardest Currency (1979)
Grill, B. “Herr der Diamanten.” www.zeit.de, 2 October 2003.
“Im Griff des Syndikats.” Der Spiegel 44 (1989), www.spiegel.de.
Kühner, C. “A diamond’s best friend—Antwerpen, Weltzentrum des Diamantenhandels.” NZZ Folio, December 1993.
Schulz, B. “Nicholas Oppenheimer—Der Diamantenkönig.” www.faz.net, 22 October 2006.
13.“Silver Thursday” and the Downfall of the Hunt Brothers (1980)
Boehringer, S. “Aufstieg mit Öl, Absturz mit Silber.” SZ-Serie: Die großen Spekulanten 17, www.sueddeutsche.de, 14 May 2008.
“Die Gebrüder Hunt verzocken sich am Silbermarkt.” www.faz.net, 26 February 2004.
14.Crude Oil: No Blood for Oil? (1990)
“Fünf Jahre Irak-Krieg—Chronik eines umstrittenen Feldzugs.” www.spiegel.de, 17 March 2008.
“Der Golfkrieg 1991.” www.faz.net, 24 February 2001.
Pollack, K. “Der gefährlichste Mann der Welt.” Der Spiegel 6 (2003), www.spiegel.de.
Pollack, K. The Threatening Storm—The Case for Invading Iraq. New York: Random House, 2002.
Thumann, M. “Trotz Blut kein Öl.” www.zeit.de, 16 June 2009.
15.The Doom of German Metallgesellschaft (1993)
Knipp, T. Der Machtkampf. Der Fall Metallgesellschaft und die Deutsche Bank. Düsseldorf: Econ Verlag, 1998.
Landler, M. “Spotlight: Heinz Schimmelbusch’s comeback.” www.nytimes.com, 10 August 2007.
”Metallgesellschaft reports talks with ex-chief fail.” New York Times, 5 April 1996.
“Missmanagement bei Metallgesellschaft.” www.manager-magazin.de, 28 August 2001.
16.Silver: Three Wise Kings (1994)
Chasan, E. “Apex Silver Mines files for bankruptcy protection.” www.reuters.com, 14 January 2009.
Fuerbringer, J. “Buffett likes silver; Soros, a silver mine.” www.nytimes.com, 26 March 1998.
Morgenson, G. “Gates putting some money in silver miner.” www.nytimes.com, 29 September 1999.
The Silver Institute, www.silverinstitute.org.
Weitzman, H. “Morales pledges to nationalize mining industry in Bolivia.” www.ft.com, 9 May 2006.
17.Copper: “Mr. Five Percent” Moves the Market (1996)
Bastian, N. “Kupferfinger sucht einen neuen Job.” www.handelsblatt.com, 12 December 2005.
Neidhart, C. “Hamanaka—der Vorstadt-Spießer.” SZ-Serie: Die großen Spekulanten 2. www.sueddeutsche.de, 29 January 2008.
18.Gold: Welcome to the Jungle (1997)
Behar, R. “Jungle Fever.” Fortune, 9 June 1997.
BHP Billiton, Minerals Companion, 2006
“Goldenes Grab.” Der Spiegel 16 (1997), www.spiegel.de.
Goold, D., and Willis, A. The Bre-X Fraud. Toronto: McClelland & Stewart, 1997.
19.Palladium: More Expensive Than Gold (2001)
Frank, R. “Eine Seltenheit: Palladium-Münzen.” www.moneytrend.at, January 2001.
United Nations Conference on Trade and Development (UNCTAD), Market Information in the Commodities Area (InfoComm), www.unctad.org/infocomm.
Wolf, C. “Palladium—Rasante Rekordjagd.” www.focus.de, 18 January 2001.
20.Copper: Liu Qibing Disappears Without a Trace (2005)
“Bad bets in the copper market.” www.economist.com, 18 November 2005.
Busch, A. “China treibt den Kupferpreis von allen Seiten in die Höhe.” www.handelsblatt.com, 12 December 2005.
Hoffbauer, A. “Die diskreten Kontrakte des Herrn Liu.” www.handelsblatt.com, 12 December 2005.
Mortished, C. “City gripped by mystery of the phantom copper dealer.” The Times, 15 November 2005.
Powell, B. “Buy! Sell! Run!” www.time.com, 20 November 2005.
21.Zinc: Flotsam and Jetsam (2005)
BHP Billiton, Minerals Companion, 2006.
International Lead and Zinc Study Group, www.ilzsg.org, 2009.
London Metal Exchange, www.lme.co.uk, 2009.
“A user guide to commodities.” Deutsche Bank, September 2008.
“Zinc in New Orleans flooded warehouses.” Reed Business Information, 2009.
“Zinc price soars after New Orleans supply freeze.” www.telegraph.co.uk, 7 September 2005.
“Zinc under supply tightness.” Metalworld, September 2005.
22.Natural Gas: Brian Hunter and the Downfall of Amaranth (2006)
“Amaranth trading led to MotherRock loss.” Bloomberg, 25 June 2007.
Energy Information Administration, www.eia.doe.gov, 2009.
“Hedge-Fonds hat angeblich fünf Milliarden Dollar verwettet.” www.handelsblatt. com, 19 September 2006.
“Hedge-Fonds MotherRock schließt.” www.handelsblatt.com, 7 August 2006.
“In sieben Tagen 4,5 Milliarden Dollar Verlust.” www.manager-magazin.de, 19 September 2006.
“Milliardenverlust von Hedge-Fonds läßt Märkte kalt.” www.fazfinance.net, 20 September 2006.
US Department of Energy, www.energy.gov, 2009.
Copeland, R. “Ten years after blowup, Amaranth investors waiting to get money back.” Wall Street Journal, www.wsj.com/articles/ten-years-after-blowup-amaranth-investors-still-waiting-for-money-back-1451524482, 1 January 2016.
23.Orange Juice: Collateral Damage (2006)
“Orange juice falls.” The New York Times, 22 January 2004.
“Orange juice rises.” The New York Times, 14 August 2004.
US Department of Agriculture (USDA). Situation and Outlook for Orange Juice. www.fas.usda.gov, February 2006.
24.John Fredriksen: The Sea Wolf (2006)
Bomsdorf, B. “John Fredriksen—Milliardär und Tankerkönig.” www.welt.de/wirtschaft/article1799093/John-Fredriksen-Milliardaer-und-Tankerkoenig.html, 14 March 2008.
“Kathrine und Cecilie Astrup Fredriksen Schnappen sich diese schönen Milliardärs-Töchter TUI?” www.bild.de/politik/wirtschaft/kaufen-diese-schoenen-milliardaers-toechter-tui-11713918.bild.html, 2 July 2010.
“Lachsfieber: Brisante Recherchen über einen Nahrungsmittelgiganten.” www.ardmediathek.de.
OECD-FAO: Agricultural Outlook 2011–2012. www.fao.org.
25.Lakshmi Mittal: Feel the Steel (2006)
Feel the Steel is the logo of Pittsburgh Steelers (www.steelers.com).
“Arcelor und Mittal. Stahl-Giganten einigen sich auf Fusion.” www.spiegel.de/wirtschaft/arcelor-und-mittal-stahl-giganten-einigen-sich-auf-fusion-a-423475.html, 25 June 2006.
“Der größte Stahlproduzent der Welt entsteht.” http://www.faz.net/aktuell/wirtschaft/rohstoffe-der-groesste-stahlproduzent-der-welt-entsteht-1192255.html, 25 October 2004.
James, J. “Steel’s new spring.” Time magazine, www.time.com, 31 October 2004.
Kanter, J., Timmons, H., and Giridharadas, A. “Arcelor agrees to Mittal takeover.” www.nytimes.com/2006/06/25/business/worldbusiness/25iht-steel.html, 25 June 2006.
Kroder, T. “Lakshmi Mittal: Der Stahlbaron aus Indien.” www.ftd.de, 25 October 2004.
“Lakshmi Mittal ‘Stahl-Maharadscha’ mit Familiensinn.” www.stern.de/wirtschaft/news/lakshmi-mittal–stahl-maharadscha–mit-familiensinn-3498140.html, 27 January 2006.
“Mittal/Arcelor Fusion perfekt.” http://www.manager-magazin.de/unternehmen/artikel/a-428605.html, 26 July 2006.
Zitzelsberger, G. “Fusion der Stahlgiganten. Ein moderner Maharadscha.” www.sueddeutsche.de/wirtschaft/fusion-der-stahlgiganten-ein-moderner-maharadscha-1.819924, 5 December 2008.
26.Crude Oil: The Return of the “Seven Sisters” (2007)
Hoyos, C. “The evolution of the Seven Sisters.” www.ft.com/content/2103f4da-cd8e-11db-839d-000b5df10621, 11 March 2007.
Hoyos, C. “The new Seven Sisters: oil and gas giants dwarf western rivals.” www.ft.com/content/471ae1b8-d001-11db-94cb-000b5df10621, 12 March 2007.
“Petro-China—Das teuerste Unternehmen der Welt.” www.faz.net, 5 November 2007.
“The Seven Sisters still rule.” www.time.com, 9 September 1978.
Vardy, N. “The new Seven Sisters: today’s most powerful energy companies.” https://seekingalpha.com/article/30922-the-new-seven-sisters-todays-most-powerful-energy-companies, 28 March 2007.
27.Wheat and the “Millennium Drought” in Australia (2007)
“Dried up, washed out, fed up.” The Economist, 4 October 2007.
“Dramatische Dürre.” www.spiegel.de, 20 April 2007.
“Dürre in Australien.” www.faz.net, 10 November 2006.
“Dürre in Australien.” www.stern.de, 2 January 2007.
“Dürre treibt Bauern in den Selbstmord.” www.stern.de, 24 October 2006.
“Extremwetter—Jahrtausend-Dürre in Australien.” www.spiegel.de, 7 November 2006.
International Grains Council (IGC), www.igc.org.uk, 2009.
“Der Weizenpreis läuft von Rekord zu Rekord.” www.faz.net, 26 February 2008.
28.Natural Gas: Aftermath in Canada (2007)
“BMO Financial hikes commodity-trading loss view.” Reuters, May 2007.
“BMO says commodity-trading losses to dent profit.” Reuters, April 2007.
“Ex-BMO trader gets fine.” www.thestar.com, 7 November 2009.
“How did BMO’s USD450M loss just materialize?” Financial Post, April 2007.
29.Platinum: All Lights Out in South Africa (2008)
Cotterill, J. “S Africa power monopoly too big to fail.” Financial Times, 6 February 2019.
“Eskom says SA needs ‘at least’ 40 new coal mines.” www.mg.co.za, 8 August 2009.
Johnson Matthey, www.matthey.com, 2009.
London Platinum and Palladium Market, www.lppm.org.uk, 2009.
“Stromausfall in Südafrika erreicht Rohstoffmärkte.” www.fazfinance.net, 25 January 2008.
30.Rice: The Oracle (2008)
Müller, O. “Angst vor Hungersnot—Hoher Reispreis macht Asien nervös.” www.handelsblatt.com, 9 April 2008.
“USA rechnen mit mehr als 100.000 Toten.” www.focus.de, 7 May 2008.
31.Wheat: Working in Memphis (2008)
“Rohstoffmärkte sind spekulativ überhitzt.” www.faz.net, 6 March 2008.
“Rogue trader rocks firm—Huge wheat futures loss stuns MF Global.” www.chicagotribune.com, 29 February 2008.
32.Crude Oil: Contango in Texas (2009)
Baskin, B. “Oil stored at sea washes out rallies.” http://online.wsj.com, 5 February 2009.
Bayer, T. “‘Super-Contango’—Unternehmen bunkern Öl.” www.ftd.de, 8 December 2008.
Hecking, C., and Bayer, T. “Abgeschmiert in der Prärie.” www.ftd.de, 19 January 2009.
33.Sugar: Waiting for the Monsoon (2010)
Abraham, T. K. “World sugar shortage to extend a third year.” Bloomberg, 29 January 2010.
Hein, C. “Indien betet für einen stärkeren Monsun.” www.faz.net, 12 August 2009.
Kazim, H. “Dürre bedroht Indiens Wirtschaft.” www.spiegel.de, 18 August 2009.
Lembke, J. “Der Zuckerpreis ist kaum zu stoppen.” www.faz.net, 7 August 2009.
Mai, C. “Zuckerpreis erreicht 25-Jahres-Hoch.” www.ftd.de, 3 August 2009.
Merkel, W. “In Indien und Australien wird die Dürre noch größer.” www.welt.de, 24 September 2009.
Stern, N. “Ernteausfälle in Indien treiben Zuckerpreis.” http://diepresse.com, 16 August 2009.
34.Chocolate Finger (2010)
“Kakao als Spielball der Spekulation.” www.faz.net, 20 July 2010.
Marron, D. “The cocoa corner: Is Choc Finger down USD 150 million?” http://seekingalpha.com, 26 July 2010.
Murugan, S. “What’s driving cocoa?” http://seekingalpha.com, 4 August 2010.
“Sweet dreams. A hedge fund bets big on chocolate.” www.economist.com/finance-and-economics/2010/08/05/sweet-dreams, 7–13 August 2010.
Werdigier, J., and Creswell, J. “Trader’s cocoa binge wraps up chocolate market.” www.nytimes.com, 24 July 2010.
35.Copper: King of the Congo (2010)
“Congo—Africa’s disaster.” www.independent.co.uk/voices/editorials/leading-article-congo-africas-disaster-2013789.html, 30 June 2010. “Kongo will mehr von eigenen Rohstoffen profitieren.” www.gtai.de, 24 June 2010.
MacNamara, W., and Johnson, M. “Disquiet over ENRC’s purchase of Congo assets.” www.ft.com/content/19fe6f94-b791-11df-8ef6-00144feabdc0, 3 September 2010.
MacNamara, W., and Thompson, C. “Congo seizes First Quantum Minerals’ assets.” www.ft.com/content/27d6e104-b530-11df-9af8-00144feabdc0, 31 August 2010.
Thompson, C., and MacNamara, W. “ENRC buys into disputed Congo project.” www.ft.com/content/870a8b2a-acda-11df-8582-00144feabdc0, 21 August 2010.
36.Crude Oil: Deep Water Horizon and the Spill (2010)
“780 Millionen Liter—die bisher größte Ölpest aller Zeiten.” www.zeit.de/wissen/umwelt/2010-08/bp-oelloch-leck-verzoegerung, 3 August 2010.
Bethge, P., and Meyer, C. “Die Alptraum-Bohrung.” www.spiegel.de/spiegel/a-713063.html, 23 August 2010.
“Ölkatastrophe im Golf von Mexiko Alarm auf Bohrinsel war offenbar abgeschaltet.” www.spiegel.de/wissenschaft/natur/oelkatastrophe-im-golf-von-mexiko-alarm-auf-bohrinsel-war-offenbar-abgeschaltet-a-708247.html, 24 July 2010.
“Ölpest im Golf von MexikoAuch BP macht die Katastrophe jetzt Angst.” www.stern.de/panorama/wissen/natur/oelpest-im-golf-von-mexiko-auch-bp-macht-die-katastrophe-jetzt-angst-3284936.html, 30 May 2010.
“Ölpest im Golf von Mexiko BP-Experten durchtrennen leckendes Öl-Rohr.” www.spiegel.de/wissenschaft/natur/oelpest-im-golf-von-mexiko-bp-experten-durchtrennen-leckendes-oel-rohr-a-698597.html, 3 June 2010.
“‘Static Kill’ erfolgreich. BP stopft Öl-Bohrloch.” www.stern.de/panorama/wissen/natur/-static-kill–erfolgreich-bp-stopft-oel-bohrloch-3537142.html, 4 August 2010.
37.Cotton: White Gold (2011)
Cancryn, A., and Cui, C. “Flashback to 1870 as cotton hits peak.” www.wsj.com/articles/SB10001424052748704300604575554210569885910, 16 October 2010.
Cui, C. “Chinese take a cotton to hoarding.” www.wsj.com/articles/SB10001424052748704680604576110423777349298, 29 January 2011.
Industrievereinigung Chemiefaser e.V. (IVC), www.ivc-ev.de.
National Cotton Council of America, www.cotton.org.
Pitzke, M. “Preisexplosion bei Baumwolle Das Ende der Billig-Jeans.” http://www.spiegel.de/wirtschaft/unternehmen/preisexplosion-bei-baumwolle-das-ende-der-billig-jeans-a-696579.html, 25 May 2010.
United States Department of Agriculture, www.usda.gov.
White, G. “Cotton price causes ‘panic buying’ as nears 150-year high.” www.telegraph.co.uk/finance/markets/8301886/Cotton-price-causes-panic-buying-as-nears-150-year-high.html, 4 February 2011.
Wollenschlaeger, U. “Baumwolle: Auf Rekordpreise folgt Rekordproduktion.” www.textilwirtschaft.de/business/unternehmen/Baumwolle-Auf-Rekordpreise-folgt-Rekordproduktion-69081?crefresh=1, 9 March 2011.
38.Glencore: A Giant Steps into the Light (2011)
Ammann, D. “King of Oil.” Orell Füssli Verlag, Zurich, 2010.
Ammann, D. “Marc Rich: Der mann, der seinen Namen verlor.” www.weltwoche.ch, 23 May 2007.
Honigsbaum, M. “The Rich list.” In The Observer, www.guardian.co.uk, 13 May 2001.
“Rohstoffhändler Marc Rich gestorben.” www.srf.ch/news/wirtschaft/rohstoffhaendler-marc-rich-gestorben, 27 June 2013.
Schärer, A. “Die Erben des Marc Rich.” www.woz.ch, 13 December 2001.
“Warum Marc Rich bei Madoff rechtzeitig ausstieg.” www.tagesanzeiger.ch/wirtschaft/unternehmen-und-konjunktur/Warum-Marc-Rich-bei-Madoff-rechtzeitig-ausstieg/story/30815433, 27 January 2011.
39.Rare Earth Mania: Neodymium, Dysprosium, and Lanthanum (2011)
Quote from: J. Perkowski, Behind China’s Rare Earth Controversy. http://www.forbes.com/sites/jackperkowski/2012/06/21/behind-chinas-rare-earth-controversy/#e5aaecd16b82, 21 June 2012.
Blank, G. “Wichtiger Rohstoff Seltene Erden. Knappheit made in China.” www.stern.de/digital/computer/wichtiger-rohstoff-seltene-erden-knappheit-made-in-china-3874186.html, 29 December 2010.
“Chinas schwere Hand auf den seltenen Erden.” www.nzz.ch/chinas_schwere_hand_auf_den_seltenen_erden-1.8096711, 22 October 2010.
Geinitz, C. “Streit mit China um seltene Erden spitzt sich zu.” www.faz.net/aktuell/wirtschaft/rohstoffe-streit-mit-china-um-seltene-erden-spitzt-sich-zu-13091.html, 25 October 2010.
Jung, A. “Rohstoffe. Wettlauf der Trüffelschweine,” www.spiegel.de/spiegel/print/d-75159727.html, 15 November 2010.
Liedtke, M., and Elsner, H. “Seltene Erden,” Bundesanstalt für Geowissenschaften und Rohstoffe.” www.bgr.bund.de, 20 November 2009.
Lohmann, D. “Kampf um Seltene Erden. Hightech-Rohstoffe als Mangelware.” www.scinexx.de/dossier-540-1.html, 13 May 2011.
Mayer-Kuckuk, F. “Strategische Metalle China verknappt Molybdän-Förderung.” www.handelsblatt.com/finanzen/maerkte/devisen-rohstoffe/strategische-metalle-china-verknappt-molybdaen-foerderung/3579078.html?ticket=ST-1201086-huIl3W7cP5RSMLdwDNFj-ap3, 1 November 2010.
40.The End? Crude Oil Down the Drain (2016)
Cunningham, N. “OPEC: the oil glut is gone.” https://oilprice.com/Energy/Crude-Oil/OPEC-The-Oil-Glut-Is-Gone.html, 14 May 2018.
Cunningham, N. “The world is not running out of storage space for oil.” https://oilprice.com/Energy/Energy-General/The-World-Is-Not-Running-Out-Of-Storage-Space-For-Oil.html, 21 January 2016.
Dennin, T. “The dawn of a new cycle in commodities.” Research Paper, Tiberius Asset Management AG, April 2016.
EIA. “Crude oil prices to remain relatively low through 2016 and 2017.” www.eia.gov/todayinenergy/detail.php?id=24532, 13 January 2016.
El Gamal, R., Lawler, A., and Ghaddar, A. “OPEC in first joint oil cut with Russia since 2001,” Saudis take ‘big hit.’” www.reuters.com/article/us-opec-meeting-idUSKBN13P0JA, 30 November 2016.
Raval, A. “‘Oil market glut will persist through 2016,’ says IEA.” www.ft.com/content/e27ff724-717e-11e5-9b9e-690fdae72044, 13 October 2015.
Shenk, M. “WTI crude falls to 12-year low at $26.14 per barrel.” www.bloomberg.com/news/articles/2016-02-10/oil-holds-losses-near-3-week-low-amid-record-cushing-supplies, 11 February 2016.
41.Electrification: The Evolution of Battery Metals (2017)
Autoverkäufe 2017. “Mercedes fährt BMW und Audi davon.” cwww.abendblatt.de/wirtschaft/article213089441/BMW-verkauft-so-viele-Autos-wie-nie.html, 12 January 2018.
BNEF New Energy Outlook, https://about.bnef.com/new-energy-outlook, 16 August 2018.
Hull, D., and Recht, H. “Tesla doesn’t burn fuel, it burns cash.” www.bloomberg.com/graphics/2018-tesla-burns-cash, 3 May 2018.
Kraftfahrtbundesamt, www.kba.de.
42.Crypto Craze: Bitcoins and the Emergence of Cryptocurrencies (2018)
Akolkar, B. “China officially bans all crypto-related commercial activities.” 22 August 2018, https://bitcoinist.com/china-officially-bans-crypto-activities/.
“Comparing 25 of the biggest cryptocurrencies.” World Economic Forum, March 2018, www.weforum.org/agenda/2018/03/comparing-the-25-most-notable-cryptocurrencies.
“Cryptoprimer.” www.investopedia.com/tech/crypto-primer-currencies-commodities-tokens/#ixzz5HfVcEWBS.
Kharif, O. “The bitcoin whales: 1,000 people who own 40 percent of the market.” https://www.bloomberg.com/news/articles/2017-12-08/the-bitcoin-whales-1-000-people-who-own-40-percent-of-the-market, 8 December 2017.
Kharpal, A. (2017): “Founders of a cryptocurrency backed by Floyd Mayweather charged with fraud by SEC.” www.cnbc.com, 3 April 2017.
Lee, J. “Mystery of the $2 billion bitcoin whale that fueled a selloff.” https://www.bloomberg.com/news/articles/2018-09-13/mystery-of-the-2-billion-bitcoin-whale-that-fueled-a-selloff, 13 September 2018.
Meyer, D. “China enlists its ‘great firewall’ to block bitcoin websites.” http://fortune.com/2018/02/05/bitcoin-china-website-ico-block-ban-firewall/, 5 February 2018.
Paul, A. “It’s 1994 In cryptocurrency.” www.forbes.com/sites/apaul/2017/11/27/its-1994-in-cryptocurrency/#7a81d58eb28a, 27 November 20017.
Potter, S., and White, T. “No end in sight for crypto sell-off as bitcoin breaches $4,250.” www.bloomberg.com/news/articles/2018-11-20/no-end-in-sight-for-crypto-sell-off-as-tokens-take-fresh-hit.
Shiller, R. “Irrational exuberance.” Crown Business, 9 May 2006.